Resolving Overlapping Mass Spec Signals: 2026 Guide
Resolving overlapping mass spec signals is defined as the process of mathematically or instrumentally separating two or more coincident spectral peaks that share the same or adjacent m/z values, causing measurement bias and misidentification. In complex proteomics, metabolomics, and environmental samples, spectral congestion is the primary source of false positives and false negatives. Recent advances in Orbitrap and FT-ICR instrumentation, Proton Transfer Charge Reduction (PTCR), and computational tools like 2D mzCompare have fundamentally changed what researchers can recover from a congested spectrum. The practical outcome is clear: better signal separation produces more reliable identifications, more accurate quantification, and scientifically defensible results.
What instrument parameters enable resolving overlapping MS signals?
High-resolution mass spectrometers set the physical ceiling for signal separation before any software is applied. Instruments like the Orbitrap and FT-ICR platforms achieve resolving powers that standard quadrupole or ion trap systems cannot match. Without sufficient resolving power, mass centroids become unreliable, creating the conditions for false positives and false negatives regardless of downstream processing.
The quantitative impact of resolving power is well documented. Increasing resolution from 60,000 to 480,000 improved sequence coverage in carbonic anhydrase top-down MS from 50.5% to 92.6%. That is nearly double the analytical coverage from a single instrument parameter change. Adding PTCR to the high-resolution acquisition pushed coverage further to 97.7%, demonstrating that hardware and spectral simplification are complementary, not interchangeable.
Key acquisition parameters that directly affect spectral overlap include:
- Resolving power setting: Higher values separate peaks at finer m/z differences but increase scan time.
- Mass range selection: Narrower windows reduce chemical noise and co-isolation.
- Chromatographic peak width: Faster gradients reduce co-elution and the number of species entering the source simultaneously.
- Ion accumulation time: Longer fill times improve signal-to-noise but can increase space charge effects.
Dual-zone mass spectrometry instruments represent the current hardware frontier. These systems separate gas species with mass differences as small as 0.005 amu, a threshold that standard resolvers cannot reach. That capability matters most in isotopologue analysis and gas mixture characterization where nominal mass resolution is completely inadequate.
Pro Tip: Before investing in computational deconvolution, audit your acquisition method. Suboptimal chromatographic conditions or low resolving power settings will propagate errors that no algorithm can fully correct downstream.
Which algorithms and software tools deconvolute overlapping MS signals?
Mass spectrometry signal deconvolution is the recognized industry term for the computational process of separating overlapping spectral components. The field has moved well beyond simple peak picking, with three algorithm families now dominating the literature: Independent Component Analysis (ICA), Parallel Factor Analysis (PARAFAC2), and direct spectral comparison methods like 2D mzCompare.
The 2D mzCompare algorithm is the most thoroughly validated for comprehensive two-dimensional chromatography data. It resolved over 95% of simulated analytes as pure singlets at low saturation and reduced 2D peak widths approximately 12-fold in GC × GC-TOFMS datasets. That 12-fold compression directly translates to cleaner component spectra and more accurate monoisotopic mass assignments.
Machine learning has entered the deconvolution space with measurable performance gains. EnvCNN, a convolutional neural network, evaluates isotopic envelopes in top-down MS data and outperforms traditional scoring functions in correctly identifying proteoforms. The practical advantage is fewer misassigned charge states in congested spectra from large intact proteins.
| Algorithm | Best use case | Key limitation |
|---|---|---|
| ICA | Chromatographic source separation | Assumes statistical independence of components |
| PARAFAC2 | Multi-sample spectral alignment | Computationally intensive for large datasets |
| 2D mzCompare | GC × GC-TOFMS deconvolution | Validated primarily at low-to-moderate saturation |
| EnvCNN | Top-down intact protein MS | Requires training data representative of sample type |
Researchers often confuse high resolution with accurate mass measurement. These are distinct but complementary requirements for confident MS results. A spectrum can have accurate mass values but still fail to resolve two closely spaced peaks, producing a composite centroid that misrepresents both components.
Pro Tip: Run 2D mzCompare or a comparable deconvolution algorithm on a known standard mixture before applying it to unknowns. Confirming recovery rates on characterized samples establishes a performance baseline for your specific instrument and matrix.
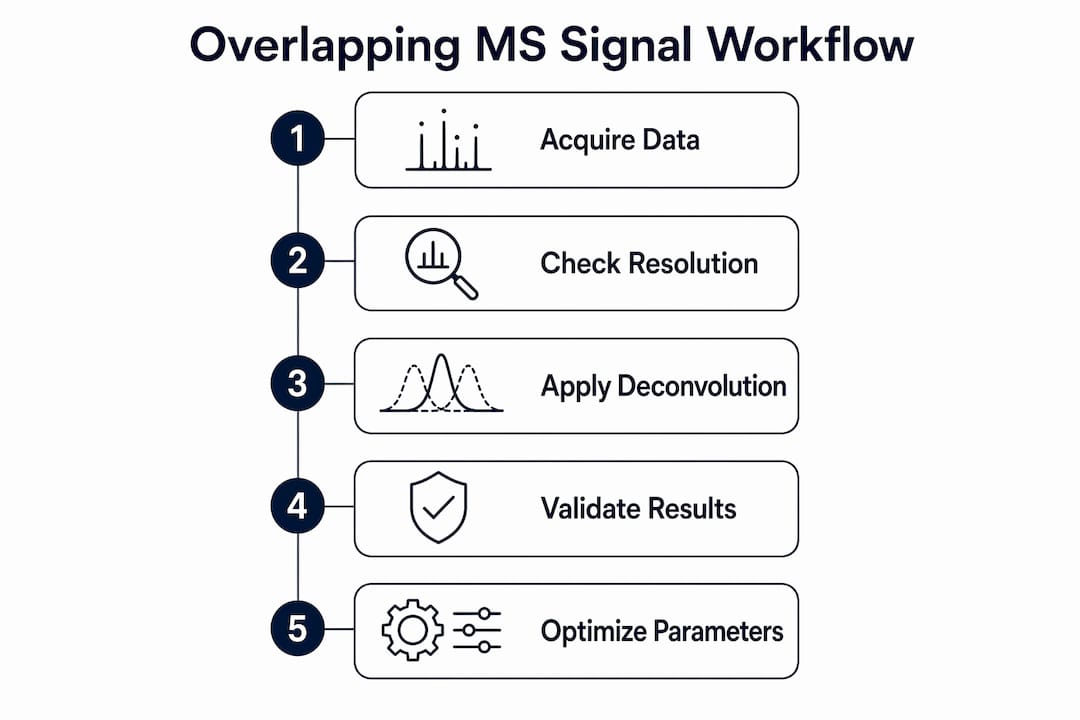
How to execute a workflow for resolving overlapping MS signals
A structured workflow prevents the most common sources of error in overlapping signals analysis. Each stage builds on the previous one, and skipping steps compounds uncertainty.
- Assess data quality first. Review total ion chromatograms and base peak spectra for signal-to-noise ratios, retention time drift, and mass accuracy. Instruments with mass errors above 5 ppm require recalibration before deconvolution.
- Tune acquisition parameters. Set resolving power to the highest value compatible with your scan speed requirements. For intact proteins above 30 kDa, activate PTCR to disperse charge states across a wider m/z range and reduce spectral congestion.
- Apply noise modeling and peak picking. Use baseline correction algorithms that model chemical noise independently from analyte signal. Incorrect baseline assignment shifts peak centroids and inflates apparent peak widths.
- Run deconvolution. Apply 2D mzCompare for multidimensional chromatography data or EnvCNN for top-down proteomics. Set component number estimates conservatively; overestimating components introduces ghost peaks.
- Validate resolved peaks. Cross-check deconvoluted masses against known standards, isotopic spacing rules, and database entries. Peaks that do not match expected isotopic patterns require manual inspection.
The table below summarizes the decision points at each workflow stage.
| Stage | Key action | Failure indicator |
|---|---|---|
| Data quality | Check mass accuracy and S/N | Mass error above 5 ppm, S/N below 10 |
| Acquisition tuning | Set resolving power, activate PTCR | Unresolved charge state envelopes |
| Noise modeling | Baseline correction | Shifted centroids, inflated peak widths |
| Deconvolution | Run 2D mzCompare or EnvCNN | Ghost peaks, missed monoisotopic assignments |
| Validation | Match isotopic patterns | Unmatched spacing, database mismatches |
Researchers working with co-eluting compounds in mass spectrometry face an additional complication: chromatographic overlap and spectral overlap compound each other. Addressing both dimensions simultaneously, through faster gradients and two-dimensional deconvolution, produces the most reliable results.
What are common challenges in resolving overlapping MS signals?
False positives and false negatives are the two most consequential failure modes in overlapping signals analysis. Insufficient resolving power masks target analyte peaks behind interference signals, producing false negatives that eliminate real compounds from downstream analysis. Overfitted deconvolution models generate ghost components, producing false positives that inflate compound lists.
Broadened or shifted peaks are frequently misinterpreted as single analytes. A composite peak formed by two species separated by less than the instrument’s resolving power will appear as a single, asymmetric peak. Recognizing asymmetry, unexpected isotopic spacing, or anomalous peak widths as indicators of unresolved overlap is a core diagnostic skill.
Computational challenges in improving mass spec resolution include:
- Model complexity vs. runtime: PARAFAC2 and similar tensor decomposition methods scale poorly with dataset size. Researchers must balance component number against processing time.
- Parameter sensitivity: Deconvolution algorithms are sensitive to initial parameter estimates. Small changes in assumed peak shape (Gaussian vs. Lorentzian vs. Voigt) can shift resolved mass values by several millimass units.
- Overfitting risk: Adding more components always improves fit statistics but does not always reflect physical reality.
Flexible multi-signal models validated by Bayes factors provide a statistically principled way to decide how many components a spectrum actually contains. Bayesian evidence penalizes model complexity, preventing the overfitting that inflates component counts in congested spectra.
“Avoiding overlapping signal models due to computational complexity can introduce hidden biases; modern statistical approaches encourage flexible modeling validated by Bayesian evidence.”
Automation in mass spec data processing reduces operator-dependent parameter choices, which are a primary source of irreproducible results across laboratories. Automated workflows with built-in statistical validation produce more consistent deconvolution outcomes than manual peak-by-peak analysis.
Key Takeaways
Resolving overlapping mass spec signals requires a combination of high resolving power, spectral simplification techniques like PTCR, and validated computational deconvolution to produce accurate, reproducible results.
| Point | Details |
|---|---|
| Resolving power is foundational | Increasing resolution from 60,000 to 480,000 nearly doubled sequence coverage in top-down MS. |
| PTCR complements high resolution | PTCR disperses charge states across wider m/z ranges, reducing congestion that resolution alone cannot fix. |
| Algorithm choice matters | 2D mzCompare resolved over 95% of simulated analytes; EnvCNN improves isotopic envelope scoring in proteomics. |
| Validate before trusting results | Cross-check deconvoluted peaks against isotopic patterns and known standards at every workflow stage. |
| Statistical models prevent overfitting | Bayes factor validation ensures component counts reflect physical reality, not algorithm artifacts. |
Why hardware and software must work together
The most persistent mistake I see in mass spectrometry workflows is treating instrument upgrades and computational tools as alternatives. They are not. A researcher who invests in an Orbitrap but runs a basic peak-picking algorithm is leaving most of the instrument’s capability unused. Conversely, applying EnvCNN or 2D mzCompare to data collected at 60,000 resolving power will not recover information that was never captured.
The PTCR finding is the clearest illustration of this principle. High resolution alone brought sequence coverage to 92.6%. Adding PTCR pushed it to 97.7%. That final 5.1 percentage points came from spectral simplification, not more hardware. The lesson is that the ceiling for signal separation is set by the combination of all methods applied, not by any single one.
Machine learning deconvolution is the area I watch most carefully. EnvCNN’s performance advantage over traditional scoring is real, but it depends entirely on training data quality. A model trained on one protein class will not generalize reliably to another without retraining or fine-tuning. Researchers adopting these tools should treat published performance benchmarks as upper bounds, not guaranteed outcomes on their specific samples.
The practical advice I give consistently: start with the best acquisition parameters your instrument supports, apply PTCR for intact proteins above 30 kDa, then select a deconvolution algorithm matched to your data dimensionality. Validate every resolved component against an independent criterion. The workflow is not glamorous, but it is the only path to results that hold up under scrutiny.
— Nadeem
How R2nsoftware supports advanced signal separation
Researchers who need to move beyond manual peak inspection will find that R2nsoftware’s PeakLab platform is built specifically for the complexity described in this article. PeakLab supports up to 1,000 peaks simultaneously, applies Gaussian, Lorentzian, and Voigt fitting functions, and integrates baseline modeling directly into the deconvolution workflow.

For automated signal processing across large datasets, R2nsoftware’s AutoSignal platform handles the parameter optimization and statistical validation steps that consume the most analyst time. Both tools are demonstrated in detail on the R2nsoftware videos page, where researchers can evaluate algorithm performance on representative mass spectrometry datasets before committing to a workflow change.
FAQ
What is mass spectrometry signal deconvolution?
Mass spectrometry signal deconvolution is the computational process of separating overlapping spectral peaks into individual components with accurate mass assignments. It applies mathematical models, including ICA, PARAFAC2, and neural network scoring, to recover distinct analyte signals from congested spectra.
How does resolving power affect overlapping signals analysis?
Higher resolving power physically separates peaks at finer m/z differences, reducing the number of composite signals that require computational correction. Increasing resolving power from 60,000 to 480,000 improved sequence coverage from 50.5% to 92.6% in documented top-down MS experiments.
When should PTCR be used for spectral overlap?
PTCR is most effective for intact proteins above 30 kDa, where high charge state density creates spectral congestion that resolving power alone cannot address. It disperses ions across a wider m/z range, separating overlapping charge state envelopes before deconvolution.
What causes false negatives in complex MS datasets?
False negatives occur when target analyte peaks are masked by overlapping interference peaks at insufficient resolving power. Broadened or asymmetric peaks in a spectrum are a diagnostic indicator that composite signals require further separation.
How does 2D mzCompare improve signal separation?
The 2D mzCompare algorithm resolved over 95% of simulated analytes as pure singlets and reduced 2D peak widths approximately 12-fold in GC × GC-TOFMS data. It applies statistical overlap theory to mathematically separate co-eluting components in comprehensive two-dimensional chromatography datasets.