
Why Statistical Significance Matters in Research Results

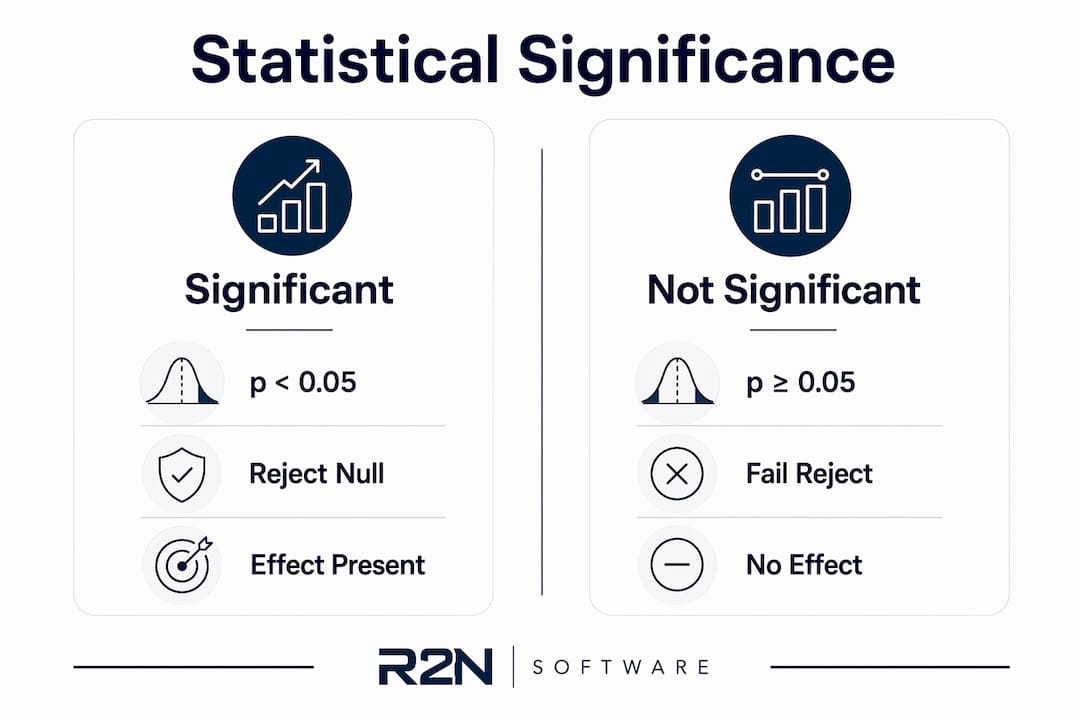
Statistical significance is defined as the condition where a p-value falls at or below a pre-specified alpha threshold, typically α = 0.05, indicating the observed effect is unlikely under the null hypothesis. This threshold functions as an evidence filter: it separates findings that warrant further investigation from those that could plausibly arise from random variation alone. Understanding why statistical significance matters in results is not optional for researchers and data analysts. It is the foundation of defensible inference, and misreading it produces cascading errors in interpretation, publication, and application.
Why does statistical significance matter for research results?
Statistical significance determines whether an observed effect clears the minimum evidentiary bar for rejecting the null hypothesis. A result with p < 0.05 means the data are sufficiently incompatible with the null that the researcher can proceed with controlled confidence. That confidence is conditional, not absolute.
The p-value is a conditional probability. It measures the probability of observing data at least as extreme as the collected data, assuming the null hypothesis is true. P-values do not measure the probability that the null hypothesis is true or false. This distinction matters enormously in practice.

The alpha level is a policy choice, not a natural law. Significance thresholds reflect deliberate tradeoffs between Type I errors (false positives) and Type II errors (false negatives). Setting α = 0.01 instead of 0.05 reduces false positive risk but increases the chance of missing real effects. Researchers must choose alpha before data collection, not after.
Several factors interact to determine what a significant result actually means:
- P-value and alpha alignment: A result is significant only when p ≤ α, where α was pre-specified. Post-hoc threshold adjustment invalidates the inference.
- Type I error rate: Alpha directly sets the long-run rate of false positives when the null is true. At α = 0.05, one in twenty tests on true null hypotheses will yield a false positive.
- Study power: Low-powered studies miss real effects and, when they do detect significance, often produce inflated effect estimates.
- False discovery rate: With α = 0.05, power = 0.80, and a base rate of 10% true effects, false discovery rates can approach 36%. That figure reframes what a single significant result actually guarantees.
- Confidence intervals: A 95% confidence interval that excludes the null value corresponds directly to p < 0.05. Confidence intervals add information about effect magnitude and precision that p-values alone cannot supply.
Pro Tip: Always report the exact p-value rather than a binary “significant/not significant” label. Exact values let readers assess the strength of evidence rather than just its side of the threshold.
What are the common misconceptions about statistical significance?
The most persistent misconception is treating p < 0.05 as proof that an effect exists. It is not. The same p-value implies different false positive risks depending on study design, prior probability of the hypothesis, and sample size. Researchers who ignore this context overstate the certainty of their conclusions.
A second major error is confusing statistical significance with practical significance. A drug that reduces systolic blood pressure by 1 mmHg may produce p < 0.001 in a trial of 50,000 participants. That result is statistically reliable. It is clinically negligible. Statistical significance does not imply practical significance; effects can be statistically reliable but too small to matter in real-world decisions.
The following numbered issues represent the most consequential misinterpretations in active research practice:
- Treating p < 0.05 as binary truth. The threshold is a decision rule, not a proof mechanism. The American Statistical Association (ASA) explicitly cautions that p-values should not be interpreted in isolation and do not measure hypothesis truth.
- Ignoring effect size. A statistically significant result with a trivially small effect size carries limited scientific value. Cohen’s d, eta-squared, and similar metrics quantify the magnitude of effects independently of sample size.
- Underpowered study designs. Underpowered studies produce statistically significant results that exaggerate effect sizes and reduce reproducibility. This is a structural problem, not a calculation error.
- P-hacking and multiple comparisons. Running many tests and reporting only those that cross α = 0.05 inflates the family-wise error rate. Bonferroni correction and false discovery rate control methods address this directly.
- Neglecting prior probability. The same p-value carries different inferential weight depending on how plausible the hypothesis was before data collection. Bayesian frameworks formalize this relationship.
“The p-value was never meant to be the sole arbiter of scientific truth. It is one input into a broader inferential process that must account for effect size, study design, replication, and prior knowledge.” — Consistent with ASA guidance on p-value interpretation
How do confidence intervals complement statistical significance?
A 95% confidence interval defines the range of effect sizes consistent with the observed data at a given confidence level. A 95% CI that excludes the null value corresponds to p < 0.05 for a two-sided test, making the two approaches mathematically equivalent when properly aligned. The critical difference is that confidence intervals communicate both the direction and the plausible magnitude of an effect.
Properly aligned significance tests and confidence intervals require matching test type and alpha level. A one-sided test at α = 0.05 aligns with a 90% one-sided CI, not a 95% two-sided CI. Mismatches between test type and CI construction produce apparent contradictions that are purely methodological, not substantive.
| Scenario | P-value result | 95% CI result | Interpretation |
|---|---|---|---|
| Large effect, large sample | p < 0.001 | Excludes null, narrow interval | Strong evidence, precise estimate |
| Small effect, large sample | p = 0.03 | Excludes null, narrow interval | Significant but potentially trivial |
| Large effect, small sample | p = 0.08 | Includes null, wide interval | Underpowered; effect may be real |
| Small effect, small sample | p = 0.45 | Includes null, wide interval | Insufficient evidence |
The table above illustrates a key point: a wide confidence interval signals low precision regardless of whether the p-value crosses the significance threshold. Narrow intervals around a meaningful effect size provide the strongest basis for inference.
Pro Tip: When reporting results, always pair the p-value with the 95% CI and the effect size metric. This triad gives readers the full inferential picture that p-values alone cannot provide.
Why does practical significance matter alongside statistical significance?
Practical significance addresses whether a statistically detected effect is large enough to matter in the context where it will be applied. Statistical tests alone do not capture practical or clinical relevance; decision-making must account for effect size, cost of errors, and operational context. A chromatographic method that reduces peak area error by 0.01% may be statistically significant across thousands of replicate injections. Whether that improvement justifies a method change depends entirely on the analytical tolerance of the application.
Evaluating practical significance requires a structured approach:
- Effect size metrics: Cohen’s d for mean differences, Pearson’s r for correlations, and odds ratios for binary outcomes each quantify magnitude independently of sample size.
- Minimum detectable effect (MDE): Define the smallest effect that would be worth acting on before data collection. Results below the MDE are practically insignificant regardless of p-value.
- Cost-benefit analysis: In clinical trials, a statistically significant reduction in a biomarker must be weighed against treatment cost, side effects, and patient burden.
- Replication and consistency: A single significant result with a small effect size carries less weight than three independent studies showing the same direction and magnitude.
- Qualitative context: Quantitative significance metrics should be interpreted alongside domain expertise, regulatory requirements, and end-user needs.
Researchers working in spectroscopy and chromatography face this challenge directly. A peak fitting algorithm that reduces residual sum of squares by a statistically significant margin may still fail to improve compound identification accuracy in complex matrices. The multivariate statistical analysis of spectra framework developed by R2nsoftware addresses this by integrating statistical significance evaluation with chemometric modeling, ensuring that detected differences translate into analytically meaningful outcomes.
Key takeaways
Statistical significance is a necessary but insufficient criterion for drawing valid conclusions from research data. It must be evaluated alongside effect size, confidence intervals, study power, and practical relevance to produce defensible scientific inference.
| Point | Details |
|---|---|
| P-values are conditional probabilities | They measure data compatibility with the null hypothesis, not the probability the null is true. |
| Alpha is a policy choice | Setting α = 0.05 controls Type I error rate but does not guarantee the absence of false positives. |
| Confidence intervals add precision | A 95% CI that excludes the null value is equivalent to p < 0.05 and communicates effect magnitude. |
| Practical significance is separate | Statistically significant effects can be too small to matter; always evaluate effect size in context. |
| Underpowered studies inflate effects | Low-power designs produce unreliable significant results and reduce reproducibility. |
Statistical significance in practice: what the field gets wrong
Researchers consistently underestimate how much study design shapes the meaning of a significant result. I have reviewed analyses where p < 0.05 was treated as the endpoint of inquiry rather than the beginning. The result gets published. The effect fails to replicate. The field moves on, slightly more confused than before.
The most consequential shift I have seen in rigorous research programs is the move away from binary significance reporting toward full estimation. Reporting an effect as “p = 0.03, d = 0.18, 95% CI [0.04, 0.32]” tells a fundamentally different story than “p < 0.05, significant.” The former invites scrutiny of the effect’s practical relevance. The latter invites nothing except acceptance or rejection at an arbitrary threshold.
Transparent reporting also means pre-registering hypotheses and alpha levels before data collection. Post-hoc threshold adjustment is not a statistical error in the narrow sense. It is a design failure that corrupts the inferential framework that significance testing depends on. The ASA’s ongoing guidance on p-value interpretation reinforces this point, and the field is slowly moving toward compliance.
The researchers who interpret significance most accurately are those who treat it as one signal within a broader analytical framework. They combine p-values with effect sizes, confidence intervals, and replication evidence. They define practical significance thresholds before analysis. They report what they found, not what they hoped to find.
— Nadeem
Analytical tools that support rigorous significance evaluation
Accurate significance evaluation requires software that handles the full analytical pipeline, from raw signal processing to statistical output. R2nsoftware builds tools specifically for researchers who need defensible quantitative results, not just p-values.

TableCurve Studio automates curve fitting across thousands of candidate equations and reports F-statistics, p-values, and confidence intervals for each model, giving researchers a statistically grounded basis for model selection. AutoSingal applies signal detection algorithms that distinguish true peaks from noise with quantified statistical confidence, directly supporting significance assessment in spectroscopic and chromatographic data. Both tools are built for researchers who need results that hold up under peer review, not just results that cross a threshold.
FAQ
What is statistical significance in simple terms?
Statistical significance means the observed result is unlikely to have occurred by chance alone, given the null hypothesis is true. A result is significant when the p-value is at or below the pre-specified alpha level, typically 0.05.
What does a p-value actually measure?
A p-value measures the probability of observing data at least as extreme as the collected data, assuming the null hypothesis is true. It does not measure the probability that the null hypothesis is true or false.
How does statistical significance differ from practical significance?
Statistical significance indicates that an effect is detectable above random noise. Practical significance indicates that the effect is large enough to matter in real-world application. A result can be statistically significant but practically negligible, particularly in large-sample studies.
Why do confidence intervals matter alongside p-values?
A 95% confidence interval that excludes the null value corresponds to p < 0.05 and also communicates the plausible range of effect sizes. Confidence intervals provide information about precision and magnitude that p-values alone cannot convey.
What happens when a study is underpowered?
Underpowered studies miss real effects and, when they do reach significance, tend to produce inflated effect size estimates. This reduces reproducibility and makes significant results from low-power designs unreliable without replication.