
What Is a Statistical Fitting Criterion? A 2026 Guide

A statistical fitting criterion is a numerical measure that quantifies the goodness of fit between observed data and a theoretical model, guiding researchers toward the most defensible model selection. The standard industry term for this concept is “goodness-of-fit measure,” though “fitting criterion” is widely used in applied statistics and data analysis workflows. Researchers working in spectroscopy, chromatography, and chemometric modeling rely on these criteria to distinguish signal from noise, prevent overfitting, and validate that a chosen model reflects the true structure of their data. Criteria such as R-squared and Reduced chi-square, the Akaike Information Criterion (AIC), and the Bayesian Information Criterion (BIC) each measure fit quality differently, and choosing among them determines the scientific credibility of your conclusions.
What is a statistical fitting criterion and why does it matter?
A fitting criterion answers one question: how well does this model describe the data? R-squared ranges from negative values to 1, where 1 indicates that the model explains all variance in the observed data. Reduced chi-square summarizes discrepancies between observed and expected values, with a value near 1.0 indicating that residual scatter matches the assumed noise level.
These criteria do more than score a single model. They provide a formal basis for comparing competing models on the same dataset. Without a quantitative criterion, model selection reduces to subjective judgment, which is not reproducible across research groups or publication cycles.

The importance of fitting criteria extends to preventing two failure modes: underfitting, where the model is too simple to capture real structure, and overfitting, where the model captures noise rather than signal. Both failure modes produce unreliable predictions. A well-chosen criterion penalizes unnecessary complexity while rewarding genuine explanatory power.
Common fitting criteria: how each one measures model quality
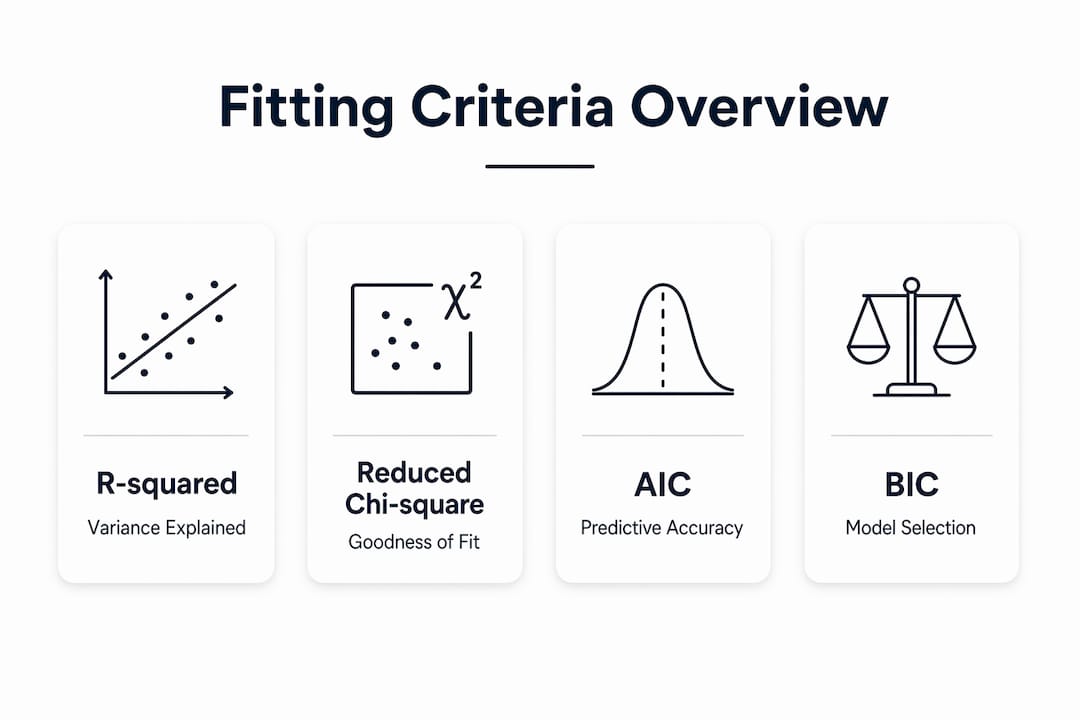
The four most widely applied criteria in statistical model evaluation are R-squared, Reduced chi-square, AIC, and BIC. Each targets a different aspect of fit quality.
| Criterion | Purpose | Complexity penalty | Typical use case |
|---|---|---|---|
| R-squared | Variance explained | None | Linear regression |
| Reduced chi-square | Residual vs. noise ratio | None | Spectroscopy, peak fitting |
| AIC | Predictive accuracy | 2k | Model comparison, prediction |
| BIC | True model identification | k ln(n) | Large-sample model selection |
R-squared measures the proportion of variance in the dependent variable that the model accounts for. It does not penalize model complexity, so adding parameters always improves or maintains R-squared even when those parameters are meaningless.
Reduced chi-square divides the residual sum of squares by the degrees of freedom. A value substantially above 1.0 signals that the model underfits the data; a value well below 1.0 suggests overfitting or overestimated noise.
AIC balances fit quality against the number of free parameters. AIC prioritizes predictive accuracy and applies a penalty of 2k, where k is the parameter count. It is the preferred criterion when the research goal is forecasting or generalization.
BIC applies a harsher penalty. The BIC formula is k ln(n) minus 2 ln(L̂), where n is the sample size and L̂ is the maximized likelihood. BIC’s penalty term exceeds AIC’s for sample sizes greater than 7, which pushes BIC toward more parsimonious models. Lower BIC values indicate preferred models, though differences are heuristic rather than absolute.
Pro Tip: Use R-squared when communicating variance explained to a non-technical audience. Switch to AIC or BIC when formally comparing models, especially if parameter count differs across candidates.
What are the challenges in selecting and using fitting criteria?
The core challenge in statistical modeling is the trade-off between goodness of fit and parsimony. A model with more parameters will almost always fit training data better. The question is whether that improvement reflects real structure or coincidental alignment with noise.
Researchers face several practical pitfalls when applying fitting criteria:
- Criterion mismatch: Measures suited to linear regression do not generalize to non-linear or discrete dependent variable models. Applying R-squared to a logistic regression model, for example, produces a misleading summary of fit quality.
- Goal confusion: AIC and BIC serve different research goals. AIC estimates relative prediction error; BIC approximates Bayesian model evidence to identify the true model from a candidate set. Using BIC when the goal is prediction, or AIC when the goal is model identification, produces the wrong answer for the right reason.
- Overreliance on criteria alone: Fitting criteria cannot warn you if all candidate models fit poorly. A criterion only ranks models relative to each other. If every candidate is misspecified, the “best” criterion value still points to a bad model.
- In-sample overfitting: Evaluating a model only on training data produces overly optimistic assessments. K-fold cross-validation splits data into K subsets and averages performance across holdout subsets, giving a more realistic estimate of generalization.
- Small sample distortions: BIC’s penalty grows with sample size, which means its behavior in small samples differs substantially from large-sample contexts. AICc, the corrected version of AIC, addresses this by adding an additional penalty term for small n.
Pro Tip: Always plot residuals after selecting a model by criterion. Systematic patterns in residuals reveal model misspecification that no information criterion will detect.
How to apply fitting criteria effectively in research workflows
Applying fitting criteria correctly requires a structured workflow, not a single calculation. The steps below reflect best practice for researchers working with nonlinear models and complex datasets.
- Define the research goal first. Decide whether the objective is prediction, inference, or true model identification. This choice determines whether AIC or BIC is the appropriate primary criterion.
- Specify a candidate model set. Fitting criteria compare models; they do not generate them. Assemble a set of theoretically motivated candidates before computing any criterion.
- Compute criteria on the same dataset. AIC and BIC values are only comparable across models fit to identical data with the same likelihood function. Mixing datasets or likelihood formulations invalidates the comparison.
- Conduct residual analysis. After criterion-based selection, test residuals for randomness, autocorrelation, and heteroscedasticity. Residual checks and predictive tests fill the gap that criteria leave open.
- Apply K-fold cross-validation. Cross-validation simulates holdout samples, reducing overly optimistic model assessments that arise from in-sample evaluation alone.
- Use likelihood ratio tests for nested models. When one model is a constrained version of another, the likelihood ratio test provides a formal significance test that complements AIC and BIC rankings.
- Integrate domain knowledge. A model that scores well on AIC but contradicts established physical or chemical theory requires scrutiny. Criteria are tools, not arbiters of scientific truth.
Sample size and parameter count interact in ways that matter for criterion interpretation. With small samples, even a two-parameter difference between models can shift BIC rankings substantially. Researchers working with complex spectral mixtures should account for this sensitivity when reporting model selection decisions.
Advanced and specialized fitting criteria for complex models
Standard criteria perform well for linear and generalized linear models. Complex, high-dimensional, or non-linear data contexts require extensions.
| Criterion | Type | Best use case |
|---|---|---|
| R-squared | Traditional | Linear regression, continuous outcomes |
| AIC / BIC | Traditional | Parametric model comparison |
| Pseudo-R-squared | Advanced | Logistic and discrete outcome models |
| FIC | Advanced | Targeted parameter estimation |
| AICc | Advanced | Small-sample correction for AIC |
The Focused Information Criterion (FIC) targets a specific parameter of interest rather than overall model fit. This makes FIC appropriate when the research question concerns a single coefficient or effect size rather than global model adequacy.
Pseudo-R-squared measures, including McFadden’s R-squared and Nagelkerke’s R-squared, adapt the variance-explained framework to discrete dependent variable models. These criteria extend fitting assessment beyond standard metrics and are standard in logistic regression reporting.
Non-linear models present additional challenges because the likelihood surface may contain local minima. A criterion value computed at a local minimum does not represent the true best fit. Researchers working with asymmetric peak shapes in spectroscopy, for example, must verify convergence before interpreting any criterion. R2nsoftware’s PeakLab addresses this directly by applying advanced mathematical algorithms to resolve overlapping signals and confirm convergence across up to 1,000 simultaneous peaks, producing criterion values that reflect genuine global fits rather than local solutions.
Key Takeaways
A statistical fitting criterion is only as useful as the workflow surrounding it. Combining criterion-based selection with residual analysis and cross-validation is the minimum standard for defensible model evaluation.
| Point | Details |
|---|---|
| Define your goal first | Choose AIC for prediction tasks and BIC for true model identification before computing any criterion. |
| No criterion is universal | Measures suited to linear models do not transfer reliably to non-linear or discrete outcome models. |
| Residual analysis is mandatory | Criteria rank models relative to each other; only residual checks confirm absolute model adequacy. |
| Cross-validation reduces overfitting bias | K-fold cross-validation estimates real-world performance more accurately than in-sample evaluation alone. |
| Advanced criteria exist for complex data | FIC and pseudo-R-squared extend model evaluation to targeted parameters and discrete outcomes. |
Fitting criteria in practice: what I’ve learned from years of model selection
The most common mistake I see researchers make is treating a low AIC or BIC value as proof that a model is correct. It is not. These criteria tell you which model is least wrong among the candidates you specified. If every candidate is misspecified, the winner is still wrong.
The second mistake is ignoring the research goal when choosing between AIC and BIC. I have reviewed analyses where BIC was applied to a prediction problem, producing a model that was parsimonious but consistently underfit on new data. The criterion was used correctly in a technical sense and incorrectly in a scientific sense.
What actually works is treating fitting criteria as one layer of a three-layer evaluation: criterion ranking, residual diagnostics, and cross-validated performance. No single layer is sufficient. Researchers who skip residual analysis because “the AIC was good” are making a decision on incomplete evidence.
The choice of criterion also needs to reflect the data structure. For spectroscopic data with overlapping peaks, Reduced chi-square relative to instrument noise is often more informative than AIC, because it directly connects the residual to the physical measurement uncertainty. Generic information criteria do not encode that domain knowledge. Matching the criterion to the data type is not optional. It is the difference between a publishable result and a retraction.
— Nadeem
R2nsoftware tools for model fitting and evaluation
Researchers who need to move from criterion selection to verified model results benefit from software that integrates fitting criteria directly into the analysis workflow.

R2nsoftware’s AutoSingal automates model selection by evaluating multiple candidate functions against your data and ranking them by fitting criteria, including AIC and Reduced chi-square, without requiring manual criterion computation for each candidate. This is particularly useful when the candidate model space is large or when the functional form of the signal is not known in advance. R2nsoftware’s PeakLab extends this capability into peak fitting, baseline correction, and mass spectrometry workflows, applying statistical fitting criteria at each stage to produce scientifically defensible results across datasets with up to 1,000 simultaneous peaks.
FAQ
What is a statistical fitting criterion in simple terms?
A statistical fitting criterion is a number that measures how well a model matches observed data. Common examples include R-squared, AIC, and BIC, each scoring fit quality differently based on the research goal.
When should I use AIC versus BIC?
Use AIC when the goal is prediction accuracy and model generalization. Use BIC when the goal is identifying the true underlying model from a set of candidates, particularly with larger sample sizes.
Can fitting criteria detect a bad model?
Fitting criteria rank models relative to each other but cannot confirm that any model is adequate in absolute terms. Residual analysis and cross-validation are required to detect systematic misfit that criteria will not reveal.
What is Reduced chi-square used for?
Reduced chi-square measures the ratio of residual variance to expected noise variance. A value near 1.0 indicates a well-fitted model; values substantially above or below 1.0 signal underfitting or overfitting, respectively.
What are pseudo-R-squared measures?
Pseudo-R-squared measures, such as McFadden’s R-squared, adapt the variance-explained framework to logistic and other discrete outcome models where standard R-squared does not apply directly.