
The Role of Statistical Models in Data Analysis

Statistical models are mathematical representations of relationships within data, designed to support prediction, parameter estimation, and the description of data-generating stochastic processes. The role of statistical models in data analysis extends far beyond simple calculation. These models translate raw observations into structured, interpretable evidence that supports hypothesis testing, uncertainty quantification, and evidence-based decisions across disciplines from clinical research to spectroscopy. Understanding how statistical modeling works, where it differs from machine learning, and how to validate results correctly separates analysts who generate defensible findings from those who generate noise.
What are the main types and components of statistical models used in data analysis?
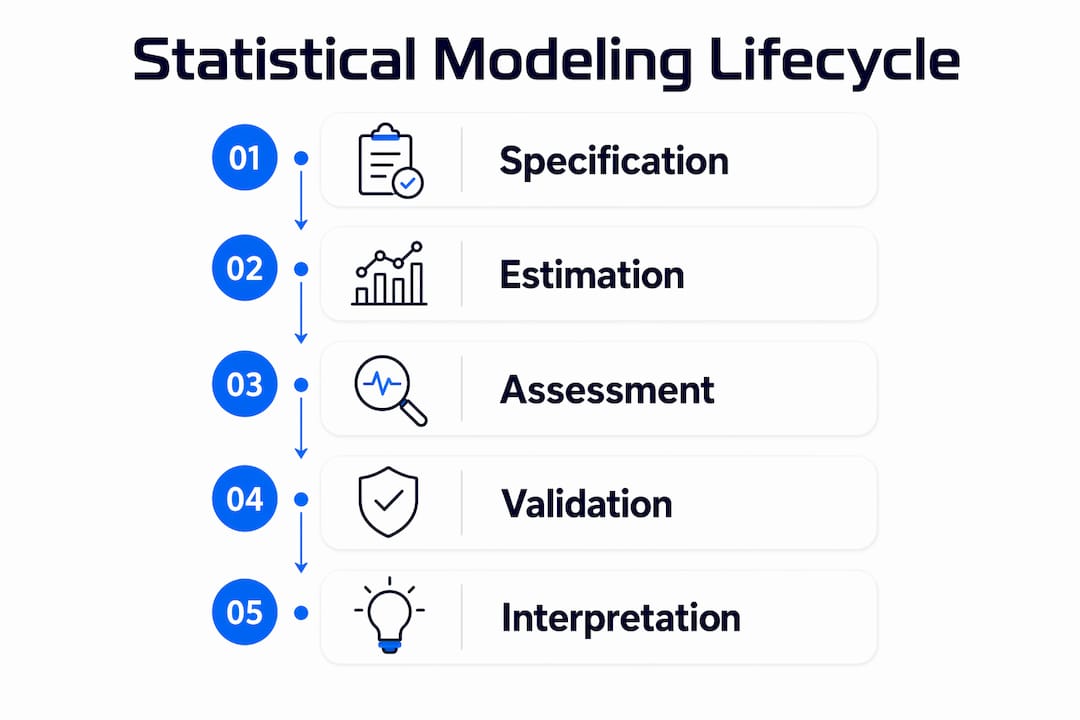
Every statistical model passes through three phases: specification, estimation, and assessment. Skipping any phase risks bias and non-reproducibility. That sequence is not optional. It is the structural backbone of any credible modeling workflow.
Specification defines the model’s mathematical form and the assumptions governing its variables. A simple linear regression assumes a linear relationship between a predictor and a response, with normally distributed residuals. A hierarchical Bayesian model, by contrast, encodes prior knowledge about parameter distributions and allows partial pooling across groups. The choice of form determines what questions the model can answer.

Estimation fits the model’s parameters to observed data. Ordinary least squares, maximum likelihood estimation, and Markov chain Monte Carlo are the most common methods. Each carries its own assumptions about the data-generating process. Maximum likelihood estimation, for example, identifies the parameter values that make the observed data most probable under the specified model.
Assessment evaluates whether the fitted model is adequate. Model comparison metrics including R-squared, AIC, the Bayes factor, and likelihood-ratio tests each address different inferential questions. R-squared measures explained variance. AIC penalizes model complexity to guard against overfitting. The Bayes factor quantifies evidence for one model over another in probabilistic terms.
- Specification: Define the model form, variables, and distributional assumptions.
- Estimation: Fit parameters using methods such as maximum likelihood or Bayesian inference.
- Assessment: Evaluate fit, compare alternatives, and check assumption violations.
Pro Tip: When selecting a model form, prioritize scientific plausibility over statistical fit alone. A Gaussian curve may fit a spectroscopic peak well numerically, but a Voigt profile that accounts for instrument broadening produces a more defensible result.
How do statistical models differ from machine learning and descriptive statistics?
The distinction matters because choosing the wrong tool produces answers to the wrong question. Statistical models provide p-values and confidence intervals, making them the required framework for scientific, clinical, and regulatory evidence. Machine learning algorithms optimize predictive accuracy but do not natively produce inferential quantities. That gap is consequential when a regulatory body requires a mechanistic explanation of an effect.
Descriptive statistics occupy a different tier entirely. Mean, median, standard deviation, and frequency distributions summarize observed data. They do not support inference or forecasting. Statistical models offer inferential power that descriptive statistics cannot provide, because models encode probabilistic theory about the process that generated the data.
| Approach | Primary purpose | Inferential output | Regulatory use |
|---|---|---|---|
| Descriptive statistics | Summarize observed data | None | Data reporting only |
| Statistical modeling | Explain mechanisms, test hypotheses | p-values, confidence intervals, credible intervals | Required for clinical and scientific review |
| Machine learning | Maximize predictive accuracy | Limited without post-hoc tools | Emerging with explainability requirements |
Hybrid workflows apply machine learning for forecasting and statistical models for explaining results. This combination balances predictive power with the interpretability that scientific and regulatory contexts demand. Post-hoc explainability tools such as SHAP can partially bridge the interpretability gap in machine learning outputs, but they do not replace the formal inferential structure of a well-specified statistical model.
Pro Tip: If your analysis must survive peer review or regulatory scrutiny, build a statistical model first. Use machine learning as a complementary forecasting layer, not as the primary inferential engine.
What practical applications demonstrate the role of statistical models in improving data interpretation?
Statistical modeling is applied widely across public health, clinical research, financial risk management, and product development. Each domain uses models to convert raw measurements into decisions with quantified uncertainty. The transformation from data to insight is not automatic. It requires a correctly specified model that reflects the actual data-generating process.
Concrete applications include:
- Public health policy: Logistic regression and survival models estimate disease incidence, treatment efficacy, and population risk factors. Epidemiologists use these outputs to allocate resources and design interventions.
- Clinical trials: Mixed-effects models account for repeated measurements within subjects, separating true treatment effects from individual variability. Regulatory submissions require these inferential outputs.
- Financial risk management: Value-at-risk models and GARCH processes quantify volatility and tail risk in asset portfolios. Traders and risk officers use these estimates to set capital reserves.
- Spectroscopy and chromatography: Curve-fitting models based on Gaussian, Lorentzian, and Voigt functions resolve overlapping peaks in spectral data. Accurate parameter estimation here directly determines compound identification and quantification.
- Product demand forecasting: Time-series models such as ARIMA and state-space frameworks decompose demand into trend, seasonality, and noise components. Supply chain teams use these forecasts to set inventory levels.
The applications of statistical modeling share a common structure: a model encodes assumptions about the system, parameters are estimated from data, and the fitted model generates predictions or inferences that guide decisions. Pairing model outputs with clear data visualization practices ensures that findings reach decision-makers in interpretable form.
For analysts working with spectral or chromatographic data, the regression analysis workflow for scientific data illustrates how these principles apply directly to peak fitting and signal deconvolution tasks.
How to ensure the validity and reliability of statistical models through assessment and validation?
Model validity does not follow automatically from a good fit metric. Ignoring assumption violations threatens the validity of inference even when R-squared or AIC values appear acceptable. A model that fits the data well but violates its own assumptions produces confidence intervals and p-values that cannot be trusted.
Rigorous validation follows a structured sequence:
- Check distributional assumptions. Plot residuals against fitted values and against each predictor. Non-random patterns indicate model misspecification or missing variables.
- Test for heteroscedasticity. Variance that changes across the range of a predictor violates the constant-variance assumption of ordinary least squares. Weighted regression or variance-stabilizing transformations correct this.
- Evaluate goodness-of-fit metrics in combination. R-squared alone is insufficient. AIC penalizes complexity. The Bayes factor quantifies evidence across competing model structures. Use at least two metrics before accepting a model.
- Conduct cross-validation or out-of-sample testing. Fit the model on a training partition and evaluate predictive accuracy on a held-out partition. This guards against overfitting to noise in the training data.
- Iterate. Update the model specification based on diagnostic findings. Iterative model validation with comprehensive diagnostics is the standard for valid inference, not a one-time check.
Analysts working with complex mixture data face additional validation challenges because overlapping signals can mask assumption violations that standard residual plots would otherwise reveal.
Key Takeaways
Statistical models are the primary tool for converting raw data into defensible, interpretable evidence, and their validity depends on correct specification, rigorous estimation, and iterative diagnostic assessment.
| Point | Details |
|---|---|
| Three-phase model lifecycle | Specification, estimation, and assessment must all be completed to avoid bias and non-reproducibility. |
| Inferential advantage over descriptive statistics | Statistical models support hypothesis testing and forecasting; descriptive statistics only summarize observed data. |
| Statistical models vs. machine learning | Use statistical models when explanation or regulatory compliance is required; use machine learning for pure prediction tasks. |
| Assumption checking is non-negotiable | Good fit metrics do not guarantee valid inference if distributional assumptions are violated. |
| Translation step is the most critical | Mis-specifying the model at the problem-formulation stage produces flawed results regardless of fitting quality. |
Why the translation step is the part most analysts get wrong
The most consequential step in any modeling workflow is not the fitting algorithm or the software platform. The translation from a subject-matter problem into a formal statistical model is the critical step. If that translation is flawed, even a mathematically correct model produces misleading answers. Statistician Sir David Cox made this point explicitly, and it remains underappreciated in practice.
I have reviewed analyses where researchers applied sophisticated hierarchical Bayesian models to data that violated the independence assumption at the observation level. The model fit looked excellent by AIC. The posterior distributions were well-behaved. The conclusions were wrong because the model did not reflect how the data were actually collected. No amount of computational sophistication compensates for a mis-specified model structure.
The practical implication is that model formulation deserves more time than model fitting. Before writing a single line of code or selecting a distribution family, analysts should map the data-generating process on paper. What are the experimental units? Are observations nested within groups? What is the causal structure connecting predictors to the outcome? Answering these questions correctly determines whether the model will produce valid inference.
Balancing complexity with interpretability is the second underappreciated discipline. A model with 40 parameters fitted to 80 observations is not a sophisticated analysis. It is an overfitted description of noise. The goal is the simplest model that adequately represents the data-generating process and answers the scientific question. That principle applies equally to linear regression in a clinical trial and to multivariate statistical analysis in spectroscopic data.
— Nadeem
How R2nsoftware supports rigorous statistical modeling workflows
Researchers who need to move from raw spectral or chromatographic data to statistically defensible results face a specific challenge: standard analytical tools do not handle overlapping signals, baseline drift, or complex peak shapes with the precision that scientific reporting requires.

R2nsoftware’s PeakLab™ addresses this directly. The platform applies advanced mathematical algorithms and statistical models, including Gaussian, Lorentzian, and Voigt deconvolution functions, to transform raw data into reproducible, peer-review-ready outputs. PeakLab™ supports up to 1,000 peaks simultaneously, resolving overlapping signals that manual or generic methods cannot separate reliably. For analysts who need to integrate automated signal detection with rigorous statistical assessment, R2nsoftware provides the analytical infrastructure that scientific and regulatory workflows demand. Explore PeakLab™ by R2nsoftware to see how it fits your modeling and reporting requirements.
FAQ
What is the role of statistical models in data analysis?
Statistical models serve three core purposes in data analysis: prediction, parameter estimation, and description of the stochastic process that generated the data. They convert raw observations into structured evidence that supports hypothesis testing and informed decisions.
How do statistical models differ from machine learning?
Statistical models prioritize explanation and inference, producing p-values and confidence intervals required for scientific and regulatory review. Machine learning prioritizes predictive accuracy but does not natively generate these inferential quantities.
What are the most important metrics for comparing statistical models?
R-squared, AIC, the Bayes factor, and likelihood-ratio tests are the primary model comparison metrics. Each addresses a different inferential question, so analysts should use at least two metrics in combination rather than relying on a single measure.
Why is model specification more important than model fitting?
A mis-specified model produces fundamentally flawed results regardless of how well the fitting algorithm performs. Correctly translating the real-world problem into a model structure is the step that determines whether conclusions are valid.
When should analysts use statistical models instead of descriptive statistics?
Descriptive statistics summarize observed data but cannot support inference or forecasting. Analysts should use statistical models whenever the goal is hypothesis testing, prediction, or quantifying uncertainty beyond what the observed sample directly shows.