
How Peak Matching Mass Spec Works: A Researcher’s Guide

Peak matching in mass spectrometry is defined as the computational alignment of experimental mass-to-charge (m/z) signals against theoretical values to confirm molecular identity. This process sits at the core of accurate mass spec data interpretation, whether you are verifying a synthetic peptide, profiling trace impurities, or annotating a complex proteomics dataset. Understanding how peak matching mass spec works requires familiarity with mass accuracy tolerances, isotopic pattern validation, and scoring algorithms that separate true biochemical signals from noise. Both single-stage MS and tandem MS/MS workflows depend on these principles to produce scientifically defensible results.
How does peak matching work in high-resolution mass spectrometry?
Mass accuracy tolerances define the foundation of every peak matching workflow. Standard identity confirmation requires matches within ±1 Da, while high-resolution mass spectrometry (HRMS) instruments achieve sub-ppm accuracy. That tighter window dramatically reduces false positives by eliminating candidates whose theoretical masses fall outside the instrument’s measured range.
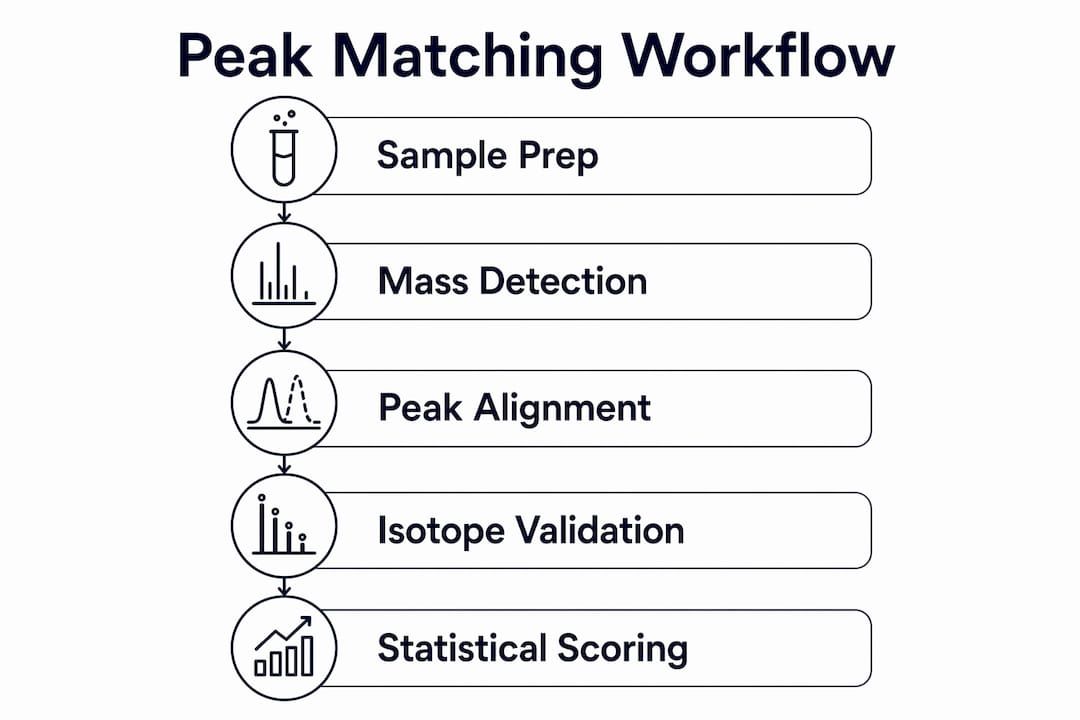
The process begins with identifying the monoisotopic mass peak, which corresponds to the ion composed entirely of the lightest stable isotopes of each element. Once that peak is located, the software compares the observed isotopic envelope against the theoretical isotopic distribution predicted from the molecular formula. A valid match requires both the monoisotopic mass and the relative isotope peak intensities to fall within user-defined tolerances.

High resolution mass spec peak assignment adds another layer of confidence through isotopic fine structure analysis. At resolving powers above 100,000 FWHM, instruments can separate isotope peaks that differ by only a few millimass units, allowing researchers to distinguish elemental compositions that share the same nominal mass. This level of discrimination is not achievable with unit-resolution instruments.
Key parameters researchers set before running a peak matching analysis include:
- Mass accuracy window: ±1 Da for low-resolution; sub-ppm for HRMS
- Isotope ratio tolerance: typically ±20% relative to theoretical abundances
- Charge state range: defined by the expected ionization state of the analyte
- Adduct list: common adducts such as [M+Na]⁺ or [M+NH₄]⁺ included in the search
Software platforms that support isotopic fine structure validation apply advanced deconvolution algorithms, such as Gaussian or Voigt profile fitting, to resolve overlapping isotope peaks before scoring the match.
Pro Tip: Set your mass accuracy window based on your instrument’s measured performance, not its theoretical specification. Run a calibration standard before each batch and record the actual ppm deviation to set a data-driven tolerance.
What is peptide-spectrum matching in tandem mass spectrometry?
Peptide-spectrum matching (PSM) is the standard term for peak assignment in MS/MS workflows. The PSM workflow consists of four core stages: spectrum preprocessing, candidate generation, theoretical spectrum construction, and scoring with statistical validation.
Spectrum preprocessing removes noise, normalizes intensities, recalibrates masses, and filters low-quality peaks. These steps directly affect downstream match quality. Preprocessing steps reduce noise and improve spectrum comparability across runs, which is why skipping them produces inconsistent results even with identical samples.
Candidate generation queries a protein sequence database to produce a list of peptides whose theoretical masses fall within the precursor mass tolerance. The search engine then constructs theoretical fragment ion spectra (b-ions and y-ions) for each candidate.
Scoring compares the theoretical spectrum against the observed MS/MS spectrum. Common scoring functions include:
| Scoring metric | Approach | Typical application |
|---|---|---|
| CosineGreedy | Cosine similarity on top-intensity peaks | Metabolomics spectral library matching |
| ModifiedCosine | Cosine similarity with mass shift correction | Analog and derivative identification |
| Cross-correlation | Measures overlap between observed and predicted spectra | Proteomics database search engines |
| Heuristic scoring | Rewards matched fragment ions, penalizes mass errors | General-purpose peptide identification |
Heuristic scoring functions reward matches where predicted fragment ions align closely with observed peaks and penalize unexplained mass errors. That design philosophy forces the algorithm to account for every significant peak, not just the ones that match.
Statistical validation uses target-decoy strategies to control the false discovery rate (FDR). Decoy sequences generate a null distribution of scores, and a threshold is set so that the proportion of decoy matches above that threshold stays below the acceptable FDR, typically 1%.
Pro Tip: Always report the FDR alongside your PSM results. A match list without FDR context is scientifically incomplete, regardless of how high the individual scores appear.
How does peak matching improve LC-MS impurity profiling?
UV chromatography alone cannot distinguish co-eluting compounds. A peak at a given retention time in HPLC provides only weak evidence of identity, because two structurally different molecules can co-elute and produce a single UV signal. LC-MS peak assignment resolves this by adding a molecular weight dimension to each chromatographic feature.
Mass-based peak matching assigns a molecular weight to every detected feature, enabling diagnostic impurity identification. Characteristic mass shifts tell researchers exactly what modification is present:
- +16 Da: oxidation of methionine or tryptophan
- +18 Da: hydration artifact
- -17 Da: deamidation or ammonia loss
- -18 Da: dehydration
- +22 Da or +44 Da: sodium or CO₂ adducts
Blank subtraction and intensity filters are non-negotiable steps before reporting impurities. Relying solely on UV peak matching for impurity profiling risks false negatives from co-elution. Mass spectrometry peak matching adds the molecular weight dimension needed to resolve co-eluted species after rigorous blank subtraction.
The table below contrasts the two approaches directly:
| Criterion | UV peak assignment | LC-MS peak matching |
|---|---|---|
| Co-elution resolution | Cannot distinguish co-eluting species | Resolves by molecular weight |
| Identity evidence | Retention time only | Retention time + exact mass |
| Impurity characterization | Quantitative, not structural | Structural via mass shift |
| False positive risk | High without reference standards | Reduced with blank subtraction |
Combining chromatographic retention time with mass spec peak assignment produces the most reliable impurity profiles. Neither dimension alone is sufficient for confident compound identification in complex matrices.
What are the main challenges in mass spec peak matching?
Artifact ions and adducts complicate peak matching by creating overlapping isotope patterns or merging peaks that are close in mass. For example, cobalt adducts (56.91754 Da) can merge with derivatives of similar mass, requiring HRMS to distinguish them. Unit-resolution instruments simply cannot separate these signals.
Charge state misassignment is another common error. Multiply-charged ions produce peak series that follow a predictable spacing pattern, but noise peaks or adducts can disrupt that pattern and cause automated algorithms to assign the wrong charge state. A clean ESI-MS spectrum displays consistent charge-state series, and unexpected peaks typically indicate impurities or degradation products.
Visual inspection of deconvoluted spectra remains the most reliable check on automated matching results. Algorithms can misinterpret noise as signal, particularly in low-abundance regions of the spectrum. Manual review catches charge misassignments and artifact peaks that scoring functions may accept.
Best practices for reliable peak matching:
- Calibrate the instrument before each analytical batch using a certified mass calibration standard.
- Apply blank subtraction to remove background ions before peak assignment.
- Inspect raw and deconvoluted spectra manually for every compound reported at low abundance.
- Verify isotope ratios against theoretical predictions, not just monoisotopic mass alone.
- Check for characteristic sister peaks at +16 Da, +18 Da, or +22 Da to distinguish modifications from artifacts.
- Set charge state limits appropriate to the molecular weight range of your analytes.
- Report FDR or mass accuracy alongside every identification to document confidence level.
Pro Tip: When a peak does not fit the expected isotope pattern, do not force a match. Unexplained isotope distortions often indicate co-eluting isobaric species or in-source fragmentation, both of which require separate investigation.
Key Takeaways
Peak matching in mass spectrometry requires monoisotopic mass identification, isotopic pattern validation, and statistically controlled scoring to produce confident, reproducible compound identifications.
| Point | Details |
|---|---|
| Mass accuracy defines match quality | Sub-ppm tolerances in HRMS reduce false positives more than any other single parameter. |
| PSM workflow has four stages | Preprocessing, candidate generation, theoretical spectrum construction, and FDR-controlled scoring all must be applied. |
| LC-MS outperforms UV for impurities | Mass-based peak assignment resolves co-eluting species that UV chromatography cannot distinguish. |
| Artifacts require manual review | Adducts and charge misassignments evade automated scoring; visual inspection of deconvoluted spectra is necessary. |
| FDR reporting is non-negotiable | Every PSM result list requires a stated false discovery rate to be scientifically valid. |
Why automated peak matching still needs a scientist behind it
After years of working with high-resolution mass spectrometry data, the pattern I keep seeing is the same: researchers trust their software output more than their own understanding of ion chemistry. That trust is misplaced. Automated scoring algorithms are powerful, but they are built on assumptions about ion behavior that do not always hold in complex biological matrices.
The most common misinterpretation I encounter is treating a high cosine similarity score as proof of identity. A score tells you how well two spectra align mathematically. It does not tell you whether the match is chemically meaningful. Two structurally unrelated compounds can produce similar fragment ion patterns if they share common neutral losses. The score passes; the identification is wrong.
The researchers who produce the most reliable mass spec data interpretation are the ones who understand isotopic distributions well enough to spot a distorted envelope without software assistance. That knowledge comes from studying the underlying ion chemistry, not from reading software documentation. High-resolution instruments and improved algorithms have made peak matching faster and more sensitive. They have not made chemical knowledge optional.
My practical advice: treat every automated match as a hypothesis, not a conclusion. Verify the isotope pattern manually. Check for characteristic adduct shifts. Look at the raw spectrum before the deconvoluted one. The extra ten minutes per compound will prevent the kind of errors that take weeks to untangle in a publication review.
— Nadeem
R2nsoftware tools for accurate peak matching workflows
Researchers who need to move beyond manual verification and scale their peak matching workflows without sacrificing accuracy have a direct path forward with R2nsoftware.

PeakLab supports isotopic fine structure validation and simultaneous fitting of up to 1,000 peaks, resolving overlapping signals that standard peak detection routines miss entirely. AutoSingal applies advanced signal detection algorithms to clean raw spectra before matching, reducing artifact-driven false positives at the source. R2nsoftware’s background subtraction tools remove matrix interference systematically, so the peaks you assign reflect real analyte signals. For researchers who need scientifically defensible results at scale, these platforms provide the mathematical rigor that manual workflows cannot sustain.
FAQ
What does peak matching mean in mass spectrometry?
Peak matching in mass spectrometry is the computational comparison of experimental m/z values against theoretical masses within defined accuracy tolerances to confirm compound identity. Matches within ±1 Da are standard; HRMS workflows achieve sub-ppm accuracy.
How does high-resolution mass spec improve peak assignment?
High-resolution instruments achieve sub-ppm mass accuracy and can resolve isotope peaks separated by only a few millimass units. That resolving power eliminates isobaric interferences that unit-resolution instruments cannot distinguish.
What is a false discovery rate in peptide-spectrum matching?
The false discovery rate (FDR) is the proportion of reported peptide-spectrum matches that are incorrect. Target-decoy strategies control FDR by modeling the null score distribution and setting a threshold that keeps false positives below an acceptable level, typically 1%.
Why does UV chromatography fail for impurity profiling?
A UV peak at a given retention time confirms the presence of a UV-absorbing compound but cannot distinguish co-eluting species or identify the molecular structure. LC-MS peak matching adds molecular weight information that resolves co-eluting impurities and identifies modifications by characteristic mass shifts.
How do adducts affect peak matching accuracy?
Adducts add a fixed mass offset to the analyte ion, shifting the observed m/z away from the theoretical value for the neutral molecule. Unaccounted adducts cause missed matches or false assignments; including common adducts such as [M+Na]⁺ and [M+NH₄]⁺ in the search parameters corrects for this.