
Electrophoresis Techniques: A Researcher’s 2026 Guide
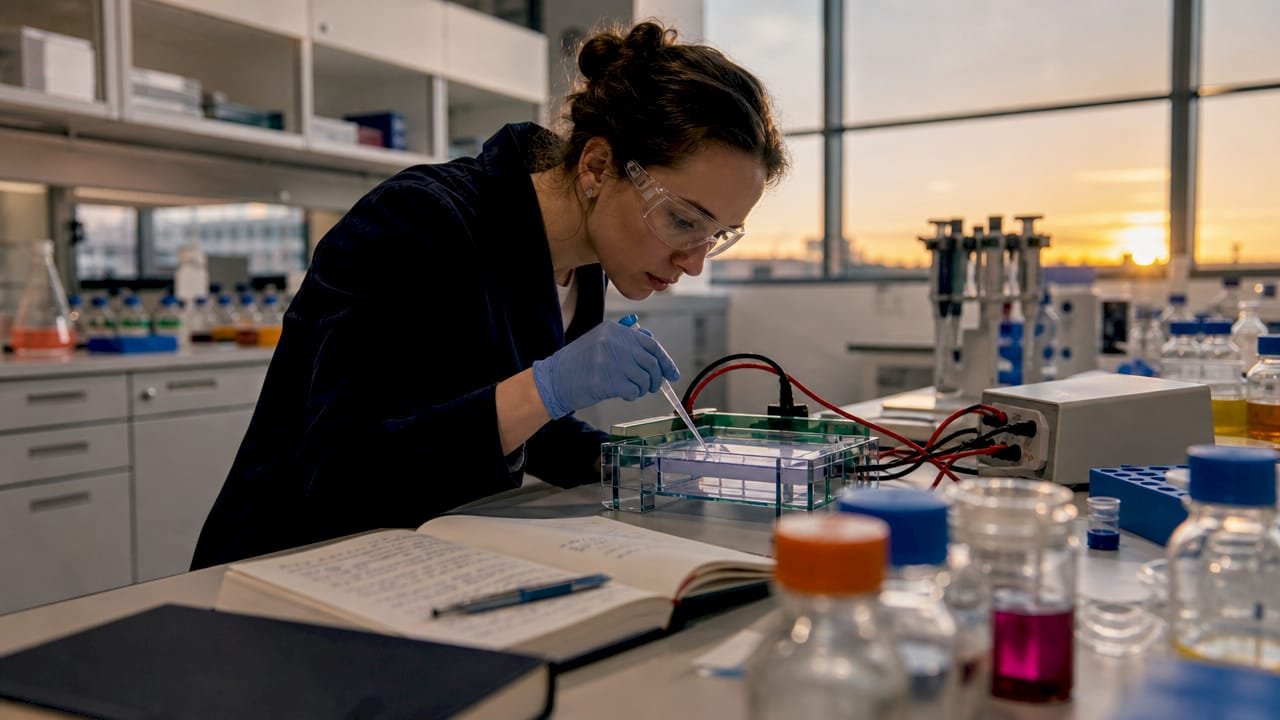
Electrophoresis is defined as the migration of charged molecules through a medium under the influence of an applied electric field, enabling size and charge-based separation of DNA, RNA, and proteins. The technique underpins molecular biology workflows from routine PCR product verification to complex proteomic profiling. Gel electrophoresis using agarose or polyacrylamide matrices remains the most widely deployed format in research labs, while capillary electrophoresis has expanded throughput in clinical and genomic applications. Selecting the correct matrix, buffer system, and voltage parameters determines whether your results are publication-ready or require a complete re-run.
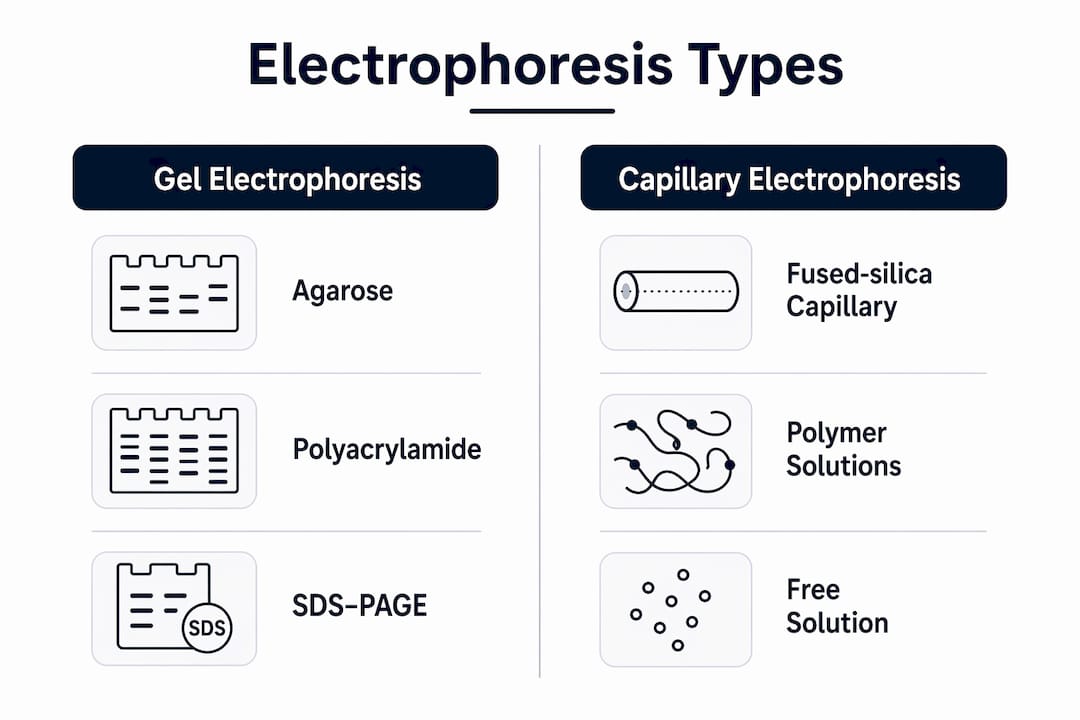
What are the main types of electrophoresis?
The types of electrophoresis in routine use divide cleanly by matrix, pore size, and target analyte. Choosing the wrong format for your sample type is the single most common source of failed separations.
Agarose gel electrophoresis
Agarose gel electrophoresis resolves nucleic acids in the 100 bp to 50 kb range, depending on gel concentration. A 0.8% agarose gel separates large fragments (5–20 kb), while a 3% gel resolves small amplicons below 300 bp. The open pore structure of agarose makes it unsuitable for protein separation, where molecular weight differences are smaller and resolution demands are higher.
SDS-PAGE and polyacrylamide gels
SDS-PAGE (sodium dodecyl sulfate polyacrylamide gel electrophoresis) is the standard electrophoresis technique for protein analysis. SDS denatures proteins and coats them with a uniform negative charge, so migration depends almost entirely on molecular weight. Polyacrylamide concentrations from 8% to 15% cover the 10–200 kDa range, with higher percentages resolving smaller proteins.
Capillary electrophoresis
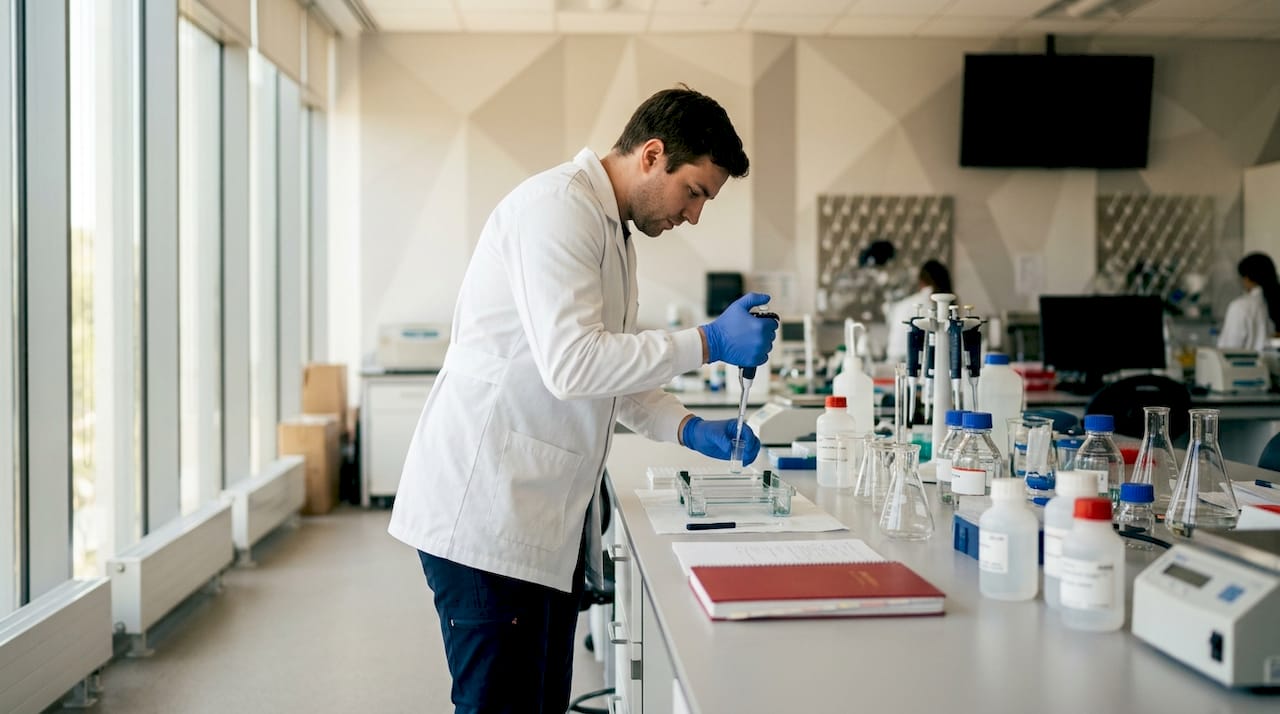
Capillary electrophoresis runs separations inside a narrow fused-silica capillary filled with a polymer solution or free buffer. The format delivers high resolution, fast run times, and direct UV or fluorescence detection without staining steps. Capillary electrophoresis is the method of choice for DNA sequencing, fragment analysis, and pharmaceutical purity testing where throughput and quantitation matter.
| Format | Matrix | Primary analytes | Typical resolution range |
|---|---|---|---|
| Agarose gel | Agarose 0.5–3% | DNA, RNA | 100 bp to 50 kb |
| SDS-PAGE | Polyacrylamide 8–15% | Proteins | 10–200 kDa |
| Native PAGE | Polyacrylamide, no SDS | Protein complexes | Charge and size dependent |
| Capillary electrophoresis | Polymer-filled capillary | DNA, RNA, proteins, small molecules | Sub-bp to >1 Mb (DNA) |
Key distinctions to keep in mind:
- Agarose gels use ethidium bromide or SYBR Safe for nucleic acid visualization; polyacrylamide gels use Coomassie or silver staining for proteins.
- Native PAGE preserves protein conformation and charge, making it useful for studying protein complexes and enzyme activity.
- Capillary electrophoresis eliminates manual staining and provides quantitative peak area data directly.
How to prepare and run gel electrophoresis for optimal results
Gel preparation quality determines band sharpness before the power supply is ever switched on. Shortcuts at this stage produce artifacts that no amount of voltage adjustment will fix.
Casting the gel
- Dissolve agarose or prepare acrylamide. Melt agarose in 1× TAE or TBE buffer by microwaving in short intervals, swirling between each. For polyacrylamide, combine acrylamide/bis-acrylamide stock with the appropriate buffer at the target percentage.
- Cool before pouring. Allow agarose to cool to approximately 55°C before adding ethidium bromide or fluorescent dye. Pour immediately to avoid premature solidification.
- Add APS and TEMED for polyacrylamide. Fresh 10% APS is critical for complete polymerization. Old APS is the leading cause of soft, under-polymerized gels. Add TEMED last and mix gently to avoid introducing bubbles.
- Degas acrylamide solutions. Vacuum degassing before adding APS and TEMED removes dissolved oxygen, which inhibits radical polymerization and produces uneven pore structure.
- Allow full polymerization. Agarose solidifies in 20–30 minutes at room temperature. Polyacrylamide requires 30–60 minutes. Do not rush this step.
Buffer selection and sample loading
TAE (Tris-acetate-EDTA) and TBE (Tris-borate-EDTA) are the two standard buffers for nucleic acid gels. TAE gives sharper bands for large fragments and is preferred for gel extraction. TBE provides better resolution for small fragments and is more resistant to pH drift during long runs.
Sample preparation requires mixing with loading dye containing glycerol and a tracking dye such as bromophenol blue. Loading dye migration lets you monitor run progress in real time and stop the gel before bands migrate off the end. Load a molecular weight ladder in at least one lane on every gel.
For SDS-PAGE, the stacking gel concentrates proteins into tight bands before they enter the resolving gel. The stacking gel typically runs at 4–5% acrylamide at pH 6.8, layered above a higher-concentration resolving gel at pH 8.8. This pH discontinuity creates the isotachophoretic stacking effect that sharpens bands.
Voltage and run time
Run 1% agarose gels at 80–100 V for approximately 45–60 minutes to produce sharp DNA bands without overheating. Higher voltages generate excess heat, causing the characteristic smiling artifact where edge lanes migrate faster than center lanes. For DNA fragments larger than 2 kb, drop field strength to 1–2 V/cm to prevent smearing and improve resolution of large fragments.
Pro Tip: Place your gel tank on a level surface and run at constant voltage rather than constant current. Voltage fluctuations during a run are a common but overlooked cause of wavy, inconsistent bands.
What are the common troubleshooting challenges and how to fix them?
Most gel artifacts trace back to three root causes: thermal effects, buffer problems, and sample preparation errors. Diagnosing which category applies cuts troubleshooting time significantly.
Thermal and voltage artifacts
Joule heating during electrophoresis distorts band shape and causes smearing. The fix is straightforward: reduce voltage, run in a cold room or on ice if the protocol permits, and never exceed the voltage range validated for your gel thickness and buffer system. Smiling bands specifically indicate uneven heat distribution across the gel width.
Buffer-related problems
- Reused buffer introduces salt buildup that creates conductivity gradients. Buffer reuse causes uneven migration and hotspots that appear as smearing or distorted lanes. Always use fresh 1× buffer for each run.
- Incorrect buffer concentration changes ionic strength and affects band migration rates. Prepare buffer from a validated 10× or 50× stock and verify the dilution.
- pH drift in TBE occurs during very long runs. Recirculating buffer between the anode and cathode reservoirs prevents this.
Sample loading errors
- Overloading protein lanes is a frequent source of streaking. Standard polyacrylamide gels tolerate 20–40 µg total protein per lane. Loading more than 50 µg causes poor resolution and streaking artifacts that obscure bands of interest.
- High salt in DNA samples compresses bands and causes distortion. Purify samples by ethanol precipitation or column cleanup before loading.
- Incomplete denaturation in SDS-PAGE produces multiple bands from a single protein. Boil samples in SDS loading buffer for 5 minutes and confirm reducing agent (DTT or beta-mercaptoethanol) is present.
Pro Tip: When a gel looks wrong, separate the chemistry from the run conditions before changing both at once. Cast a fresh gel with new APS and run it at a known-good voltage. If the artifact disappears, the problem was gel polymerization. If it persists, the buffer or sample is the culprit.
Equipment selection should match your sample type and throughput requirements. A power supply that cannot hold constant voltage under changing resistance will introduce run-to-run variability that mimics sample preparation errors.
How to analyze and interpret electrophoresis results effectively
Accurate interpretation requires more than visual inspection of band position. Systematic analysis using reference standards and quantitative tools produces defensible conclusions.
Using molecular weight ladders
A molecular weight ladder loaded in every gel provides the reference frame for size estimation. Plot the log of each ladder band’s molecular weight against its migration distance. The resulting linear relationship lets you interpolate the size of unknown bands with reasonable accuracy. Use a ladder that spans the expected size range of your target molecules.
Reading band characteristics
- Band sharpness reflects gel quality, sample purity, and run conditions. Diffuse bands indicate overloading, degradation, or excessive run time.
- Migration distance is the primary measurement for size estimation. Measure from the well to the center of each band.
- Band intensity correlates with quantity when using fluorescent or densitometric detection. Comparing intensities across lanes requires equal loading, confirmed by a housekeeping protein or total protein stain.
- Co-migration of proteins with similar molecular weights produces a single band that appears to represent one species. Co-migrating proteins create a false impression of purity. Two-dimensional electrophoresis or mass spectrometry is required to resolve co-migrating species definitively.
Controls and replicates
Every gel should include a positive control (known sample), a negative control (buffer only), and a loading control. Running technical replicates across at least two independent gels confirms that a band pattern reflects biology rather than a gel artifact. Reproducibility across replicates is the minimum standard for publication-quality data.
Software tools for band analysis
Quantitative band analysis requires densitometry software capable of baseline correction and peak fitting. R2nsoftware’s PeakLab platform applies advanced mathematical algorithms to resolve overlapping signals, a direct parallel to the co-migration problem in gel analysis. For researchers working with spectral data generated downstream of electrophoresis, fitting asymmetric peaks is a documented challenge that purpose-built software addresses more reliably than generic image analysis tools.
| Analysis task | Method | Key metric |
|---|---|---|
| Size estimation | Ladder regression | Migration distance vs. log MW |
| Quantitation | Densitometry | Integrated band intensity |
| Purity assessment | Band counting | Number of distinct bands per lane |
| Co-migration detection | 2D-PAGE or MS | Spot pattern or mass spectrum |
Key Takeaways
Electrophoresis reliability depends on gel polymerization quality, fresh buffer use, controlled voltage, and systematic interpretation using molecular weight ladders and quantitative software.
| Point | Details |
|---|---|
| Match matrix to analyte | Use agarose for nucleic acids and polyacrylamide for proteins to get the correct size resolution range. |
| Control voltage and heat | Run 1% agarose gels at 80–100 V; drop to 1–2 V/cm for DNA fragments larger than 2 kb. |
| Use fresh reagents every run | Prepare APS daily and use fresh buffer each run to prevent polymerization failure and migration artifacts. |
| Load within validated limits | Keep protein loads at 20–40 µg per lane to avoid streaking and maintain band resolution. |
| Verify with controls and software | Include a ladder, positive control, and densitometry analysis on every gel to produce defensible data. |
What I’ve learned from years of watching gels go wrong
By Nadeem
The most expensive mistake I see in electrophoresis labs is not a reagent error. It is the habit of changing multiple variables at once when a gel fails. A researcher gets a smeared gel, so they replace the buffer, increase the voltage, and recast with new agarose simultaneously. When the next gel looks better, they have no idea which change fixed the problem. The next failure will be just as mysterious.
Methodical troubleshooting means changing one variable per run. It takes longer in the short term and saves weeks in the long term. The same discipline applies to gel casting: I have seen labs where APS is stored for weeks at room temperature and nobody questions why their polyacrylamide gels are inconsistent. Fresh APS, prepared daily, is not a suggestion. It is the difference between a gel that works and one that does not.
The second thing I would tell any researcher is to take band interpretation seriously. A single sharp band does not mean a pure protein. Co-migration is real, and it has led to incorrect conclusions in published literature. Two-dimensional separation or downstream mass spectrometry should be the standard for any sample where purity matters. Gel images are a screening tool, not a final answer.
— Nadeem
Advanced data analysis for electrophoresis researchers
Gel imaging produces raw data. Extracting quantitative, reproducible results from that data requires software built for the complexity of overlapping bands, asymmetric peaks, and noisy baselines.

R2nsoftware’s AutoSingal platform processes electrophoresis band data using advanced peak fitting and baseline correction algorithms, resolving overlapping signals that manual densitometry misses. PeakLab™ supports up to 1,000 peaks simultaneously, making it applicable to high-complexity gel patterns and downstream spectral data from mass spectrometry workflows. Researchers who need to move from gel image to publication-quality quantitation can access tutorial videos covering the full analysis workflow. For labs where reproducibility and scientific defensibility are non-negotiable, R2nsoftware provides the analytical infrastructure to meet that standard.
FAQ
What is electrophoresis used for in biology?
Electrophoresis in biology separates DNA, RNA, and proteins by size and charge, enabling applications from PCR product verification to proteomic profiling. It is the foundational separation technique in molecular cloning, forensic analysis, and clinical diagnostics.
How does gel electrophoresis work?
Gel electrophoresis works by applying an electric field across a porous gel matrix, causing negatively charged molecules to migrate toward the positive electrode at rates determined by their size. Smaller molecules move faster and travel farther from the well.
What voltage should I use for agarose gel electrophoresis?
Run 1% agarose gels at 80–100 V for 45–60 minutes to produce sharp bands without overheating. For DNA fragments larger than 2 kb, reduce field strength to 1–2 V/cm to prevent smearing.
What causes smearing in gel electrophoresis?
Smearing results from Joule heating due to excess voltage, reused buffer with salt buildup, or degraded DNA samples. Using fresh buffer, running at validated voltage, and purifying samples before loading resolves most smearing artifacts.
How much protein should I load per lane in SDS-PAGE?
Load 20–40 µg of total protein per lane in standard polyacrylamide gels. Exceeding 50 µg causes streaking and poor band resolution that compromises quantitative interpretation.