
Multivariate Statistical Analysis: A Complete Guide

Multivariate statistical analysis is defined as the simultaneous examination of three or more variables to understand their complex interactions and underlying patterns within a dataset. Where univariate analysis examines a single variable and bivariate analysis compares two, multivariate methods capture the full dimensionality of real-world data. Each observation in a multivariate dataset forms a random vector, and the relationships among variables are summarized by a covariance matrix. Techniques like Principal Component Analysis (PCA) and MANOVA extract structure from that matrix, making multivariate statistical analysis indispensable for research, predictive modeling, and data-driven decision-making.
What is multivariate statistical analysis and why does it matter?
Real-world problems are multidimensional, and univariate or bivariate methods oversimplify them, risking missed interactions and flawed conclusions. A clinical researcher studying disease risk cannot isolate blood pressure from cholesterol, age, and BMI without losing critical explanatory power. Multivariate methods analyze all those variables together, revealing how they jointly influence an outcome. That joint analysis is what separates defensible findings from incomplete ones.
The importance of multivariate analysis in research extends beyond academia. Business analysts use it to evaluate customer behavior across dozens of metrics simultaneously. Environmental scientists apply it to sensor arrays measuring temperature, pH, salinity, and turbidity at once. The method improves decision-making by revealing hidden dynamics that simpler models cannot detect. Choosing multivariate methods is not about complexity for its own sake. It is about matching the analytical tool to the actual structure of the data.

What are the main multivariate analysis techniques?
PCA, Factor Analysis, MANOVA, and Cluster Analysis are the four most widely applied multivariate statistical methods, each serving a distinct analytical purpose. Selecting the right technique depends entirely on the research question, not on familiarity or convenience.
| Technique | Primary objective | Best-suited scenario |
|---|---|---|
| Principal Component Analysis (PCA) | Dimensionality reduction | High-dimensional data with correlated variables |
| Factor Analysis | Latent variable identification | Survey data, psychometric scales |
| MANOVA | Compare groups on multiple outcomes | Experimental designs with several dependent variables |
| Cluster Analysis | Group observations by similarity | Customer segmentation, species classification |
PCA transforms correlated variables into a smaller set of uncorrelated components, preserving the maximum variance in the data. Researchers in spectroscopy and chromatography use PCA to reduce hundreds of spectral channels to a handful of interpretable components. Factor Analysis goes further by modeling the latent constructs that drive observed correlations, making it the standard tool in psychometrics and social science measurement.
MANOVA extends the logic of ANOVA to situations where an experiment produces multiple dependent variables. A pharmaceutical trial measuring efficacy, side-effect severity, and biomarker levels simultaneously calls for MANOVA rather than three separate ANOVAs, which would inflate the Type I error rate. Cluster Analysis requires no predefined groups. It partitions observations based on distance or similarity metrics, making it the method of choice for exploratory segmentation tasks.
Multivariate techniques divide into two broad categories: dependence methods (MANOVA, regression) model a relationship between predictor and outcome variables, while interdependence methods (PCA, Cluster Analysis) seek structure within the variables themselves without designating a response variable.
Pro Tip: Before selecting a technique, write out your research question in one sentence. If it contains the word “predict” or “compare,” use a dependence method. If it contains “group” or “reduce,” use an interdependence method.
What mathematical foundations underpin multivariate analysis?
The covariance matrix is the central mathematical construct in multivariate analysis. It captures variances and covariances that define the geometric structure of the data, mapping how each variable moves in relation to every other variable. Without understanding the covariance matrix, interpreting PCA or Factor Analysis output is guesswork.
Eigenvalues and eigenvectors derived from the covariance matrix reveal the principal axes of variation. Each eigenvalue quantifies the amount of variance explained by its corresponding eigenvector, which defines a direction in the variable space. PCA retains the eigenvectors with the largest eigenvalues, discarding directions that contribute little variance and thus little information.
Data preprocessing is equally critical. Ignoring baseline correction, centering, and scaling causes models to capture noise or measurement artifacts rather than true signal variation. Spectroscopic data, for example, requires baseline correction before any multivariate modeling, or the resulting components will reflect instrument drift rather than chemical composition.
Key preprocessing steps before running any multivariate analysis:
- Mean centering: Subtract the column mean from each variable so the origin of the data space sits at the data centroid.
- Scaling (standardization): Divide each variable by its standard deviation to prevent high-variance variables from dominating the analysis.
- Outlier detection: Identify and assess leverage points that could distort covariance estimates.
- Missing value treatment: Impute or remove missing observations before computing the covariance matrix.
- Noise reduction: Apply smoothing or baseline correction for spectral and time-series data.
Permutation-based methods like PERMANOVA relax normality assumptions, providing valid inference when parametric requirements fail. This broadens the applicability of multivariate analysis to ecological, sensor-based, and non-Gaussian datasets.
Pro Tip: Always inspect your covariance matrix before running PCA. If the diagonal values (variances) differ by orders of magnitude across variables, standardize the data first. Failure to do so will bias every principal component toward the highest-variance variable.
What are the applications of multivariate analysis across fields?
Multivariate analysis transforms complex data into insights supporting predictive modeling, segmentation, and hypothesis testing across a wide range of disciplines. The method is not domain-specific. Its value scales with the complexity of the problem.
Practical application scenarios include:
- Marketing and customer analytics: Analysts combine variables like ad creative, audience demographics, timing, and channel to predict conversion rates and refine retention strategies. PCA reduces the variable set to interpretable segments, while Cluster Analysis groups customers by behavioral profile.
- Biomedical research: Researchers apply MANOVA and discriminant analysis to identify biomarker panels that distinguish disease states from healthy controls. A single biomarker rarely achieves diagnostic accuracy; a multivariate panel does.
- Spectroscopy and chromatography: PCA and partial least squares (PLS) regression decompose spectral data into chemical components, enabling quantitative analysis of complex mixtures. R2nsoftware’s PeakLab analytical tools support this workflow with advanced baseline modeling and peak fitting algorithms.
- Environmental monitoring: Cluster Analysis groups sampling sites by water chemistry profiles, identifying pollution sources that no single variable would reveal.
- Business performance evaluation: Executives use Factor Analysis to reduce dozens of KPIs to a small set of latent performance dimensions, making strategic comparisons tractable.
- Quality control in manufacturing: MANOVA tests whether a process change affects multiple quality metrics simultaneously, preventing the false confidence that comes from testing each metric in isolation.
Multivariate approaches reveal interactions that simpler models miss entirely. A univariate model might show that temperature affects yield. A multivariate model shows that temperature interacts with humidity and catalyst concentration to affect yield, providing a far more complete picture for process optimization.
How to perform multivariate statistical analysis step by step
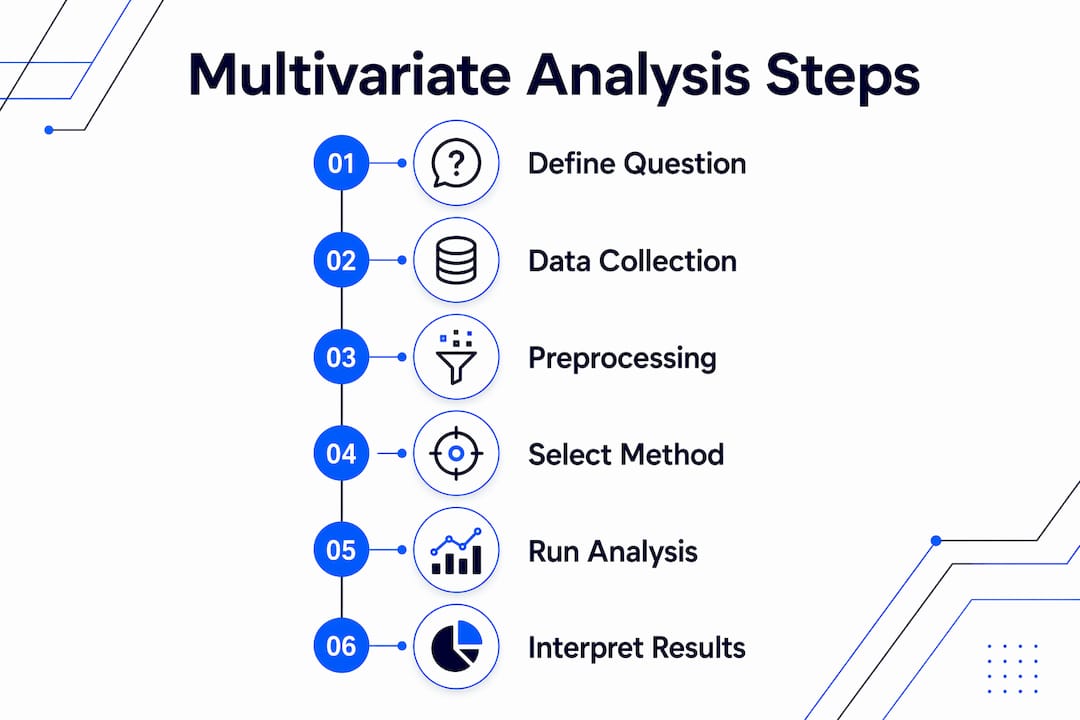
Conducting multivariate analysis follows a defined sequence: data collection, preprocessing, method selection, analysis execution, and result interpretation. Skipping or rushing any step undermines the validity of the findings.
Best practices at each stage:
- Data collection: Define variables based on the research question before collecting data. Collecting irrelevant variables inflates dimensionality without adding explanatory power.
- Preprocessing: Apply mean centering, scaling, and noise reduction as described. Document every transformation for reproducibility.
- Method selection: Match the technique to the research objective. Aligning technique with research question is the single most important factor in obtaining meaningful results. Exploratory goals call for PCA or Cluster Analysis. Causal or comparative goals call for MANOVA or regression.
- Analysis execution: Verify software settings, confirm that the covariance or correlation matrix is computed correctly, and check that the algorithm converges.
- Result interpretation: Report eigenvalues and variance explained for PCA. Report Wilks’ lambda and F-statistics for MANOVA. Visualize cluster membership with dendrograms or scatter plots.
- Assumption checking: Test for multivariate normality using Mardia’s test or Henze-Zirkler’s test. If assumptions fail, apply permutation-based alternatives.
- Validation: Use cross-validation or holdout samples to confirm that patterns are not artifacts of the specific dataset.
Multivariate analysis succeeds when practitioners focus on research objectives and select techniques accordingly, rather than applying methods indiscriminately. The Monte Carlo simulation methods used in advanced statistical software provide an additional layer of validation for complex multivariate models.
Key Takeaways
Multivariate statistical analysis requires correct method selection, rigorous data preprocessing, and interpretation grounded in the covariance structure of the data.
| Point | Details |
|---|---|
| Core definition | Multivariate analysis examines three or more variables simultaneously to reveal complex interactions. |
| Technique selection | Match the method to the research goal: PCA for reduction, MANOVA for group comparison, Cluster Analysis for segmentation. |
| Preprocessing is non-negotiable | Centering, scaling, and noise reduction prevent artifacts from dominating the covariance matrix. |
| Covariance matrix is foundational | Eigenvalues and eigenvectors derived from it drive PCA and Factor Analysis outputs. |
| Applications span every field | Marketing, biomedical research, spectroscopy, and environmental science all rely on multivariate methods. |
Why I think most researchers apply multivariate analysis in the wrong order
The most common mistake I see is technique-first thinking. A researcher learns PCA, then looks for data to apply it to. That sequence produces technically correct but scientifically meaningless output. The research question must come first, always. The technique is a tool selected to answer that question, not the other way around.
The second mistake is underestimating preprocessing. I have reviewed analyses where the first principal component explained 80% of the variance, which sounds impressive until you realize it was tracking a baseline drift artifact, not a real chemical or behavioral signal. Proper centering and baseline correction would have redistributed that variance across meaningful components. The math was right. The data preparation was wrong. The conclusion was worthless.
Multivariate methods are more accessible than ever. Modern software handles the linear algebra automatically. That accessibility creates a new risk: researchers run analyses without understanding what the covariance matrix actually contains. I recommend computing and inspecting the covariance matrix manually at least once before relying on automated outputs. That single exercise builds more intuition than any textbook chapter.
The field is evolving toward permutation-based and nonparametric multivariate methods, which is genuinely good news for practitioners working with ecological, spectral, or sensor data where normality assumptions rarely hold. Learning PERMANOVA alongside classical MANOVA is no longer optional for serious applied researchers. It is the current standard of practice.
— Nadeem
R2nsoftware tools for multivariate data analysis
Researchers who need to move from raw spectral or chromatographic data to validated multivariate results require software that handles baseline correction, peak fitting, and covariance-based modeling in a single workflow.

R2nsoftware’s PeakLab platform supports up to 1,000 simultaneous peaks, applies advanced baseline modeling, and integrates the preprocessing steps that multivariate analysis demands. The AutoSignal tool extends this capability to signal processing and automated spectral decomposition. For researchers building their analytical skills, the R2nsoftware video library provides step-by-step tutorials covering multivariate workflows, from data import through result interpretation. These resources complement the conceptual foundation in this article with applied, software-specific guidance.
FAQ
What is multivariate statistical analysis in simple terms?
Multivariate statistical analysis is the study of three or more variables at the same time to understand how they relate to each other and jointly influence outcomes. It goes beyond comparing two variables by capturing the full complexity of real-world data structures.
How does PCA differ from Factor Analysis?
PCA reduces dimensionality by creating uncorrelated components that maximize explained variance, while Factor Analysis models the latent constructs that cause observed correlations among variables. PCA is primarily a data reduction tool; Factor Analysis is a measurement model.
When should you use MANOVA instead of multiple ANOVAs?
MANOVA is the correct choice when an experiment produces multiple dependent variables measured on the same subjects, because running separate ANOVAs inflates the Type I error rate. MANOVA tests all dependent variables simultaneously while controlling that error rate.
Why is data preprocessing critical for multivariate analysis?
Skipping centering, scaling, or baseline correction causes the covariance matrix to reflect measurement artifacts rather than true variable relationships. The resulting components or clusters describe noise, not the underlying scientific signal.
Can multivariate analysis be used on small datasets?
Multivariate analysis is valuable for moderate datasets, not only large ones. The key requirement is that the number of observations substantially exceeds the number of variables, and that the technique chosen aligns with the research objective rather than the data volume.