
Mass Spectral Deconvolution: A Researcher’s 2026 Guide

Mass spectral deconvolution is defined as the computational separation of overlapping spectral signals into their individual pure component spectra, enabling accurate identification and quantification of compounds in complex mixtures. Without this process, co-eluting species in liquid chromatography-mass spectrometry (LC/MS), gas chromatography-mass spectrometry (GC/MS), or plasma emission spectroscopy produce fused, unresolvable signals that defeat standard peak assignment. Tools like Unidec, PyMESpec, and AMDIS have made deconvolution accessible across proteomics, environmental analysis, and catalysis research. R2nsoftware’s PeakLab extends these capabilities further, supporting up to 1,000 simultaneous peaks with integrated baseline modeling. Understanding what is mass spectral deconvolution, and which methods apply to your data type, is the first decision that determines whether downstream analysis is defensible.
What is mass spectral deconvolution and how does it work?
Mass spectral deconvolution operates on a core mathematical premise: the observed spectrum is a convolution of individual component spectra and an instrument response function. Reversing that convolution, extracting each pure component signal, requires both a model of peak shape and an algorithm that assigns observed peaks to their source species.
The process typically follows three sequential steps:
- Isotope cluster grouping: Observed peaks are grouped into isotope envelopes based on mass spacing and charge state patterns. In top-down proteomics and LC/MS, isotope envelope extraction is the foundational step before any mass assignment can occur.
- Charge state deconvolution: Each isotope cluster is assigned a charge state, converting observed m/z values to neutral monoisotopic masses. Bhattacharyya-scored greedy algorithms are one established method for this assignment, with score thresholds typically set above 0.5 for reliable results.
- Peak assignment and reconstruction: Deconvolved masses are matched to reference databases or used to reconstruct pure component spectra for quantification.
Algorithmic approaches vary considerably in complexity. Greedy hierarchical strategies, which process the most intense peaks first, reduce misassignment of overlapping isotope envelopes. Hierarchical peak assignment is not optional in dense spectra; skipping it produces systematic errors in quantitative results. Chemometric methods such as Alternating Least Squares (implemented as FroALS in PyMESpec) and Nonnegative Matrix Factorization (NMF) decompose the full spectral matrix into concentration profiles and pure component spectra simultaneously.
Parameter selection governs accuracy more than algorithm choice does. Intensity thresholds and mass tolerances, such as a 10 ppm mass tolerance window, must be tuned to the instrument resolution and sample complexity. Default parameters routinely produce false positives or missed signals in real datasets.

Pro Tip: Before selecting an algorithm, characterize your instrument’s peak shape function (Gaussian, Lorentzian, or Voigt) and set mass tolerance to match your instrument’s measured resolving power. Applying a 10 ppm tolerance to a low-resolution instrument will generate systematic misassignments regardless of which deconvolution algorithm you use.
Traditional vs. machine learning approaches to spectral deconvolution
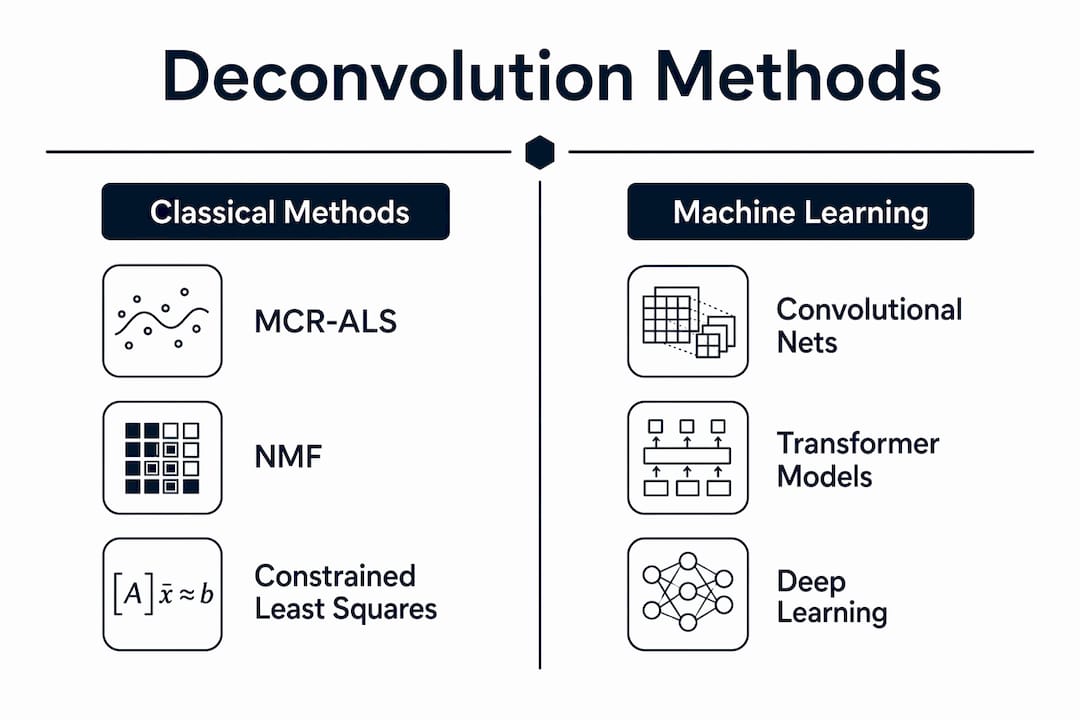
Multicomponent spectral deconvolution methods divide into two broad categories: classical mathematical and chemometric methods, and modern machine learning approaches. Each carries distinct tradeoffs in reproducibility, computational cost, and data requirements.
Classical chemometric methods
| Method | Approach | Strengths | Limitations |
|---|---|---|---|
| MCR-ALS | Iterative least squares with constraints | Physically interpretable, validated | Requires rank estimation, slow on large datasets |
| NMF (FroALS, FroFPGM) | Matrix factorization with non-negativity | Non-negative solutions, chemically realistic | Sensitive to initialization |
| NNLS | Non-negative least squares | Fast, stable | Requires known reference spectra |
| Wavelet smoothing | Signal decomposition | Effective noise reduction | Does not resolve component identity |
| Curve fitting | Peak shape modeling | Direct, interpretable | Fails with severe overlap |
MCR-ALS and NMF enforce non-negativity and unimodality constraints, which prevent mathematically valid but physically impossible spectral solutions. This constraint-based approach is what separates chemometric deconvolution from blind signal processing. PyMESpec implements FroALS and FroFPGM specifically to guarantee non-negative, physically meaningful decompositions.
Machine learning and deep learning methods
Convolutional neural networks such as EnvCNN and transformer architectures such as AMTrans represent the current frontier in deconvolving complex mass spectra. EnvCNN and AMTrans outperform classical curve-fitting in resolving severely overlapped signals, particularly where instrument resolution limits are exceeded. They recover texture detail in spectral envelopes that classical methods smooth over.
The tradeoff is significant. Traditional methods offer better reproducibility in regulated analytical settings because their performance does not depend on training dataset composition. Machine learning models trained on one instrument type or sample class can fail silently when applied to different experimental conditions. Validation burden for ML-based deconvolution in regulated environments (pharmaceutical QC, environmental monitoring) remains substantially higher than for classical methods.
Pro Tip: Use machine learning methods for discovery-phase work where throughput and sensitivity matter most. Switch to validated classical methods like MCR-ALS or NNLS when results must be submitted to regulatory bodies or reproduced across laboratories.
What are the core challenges in deconvolving complex mass spectra?
Practical deconvolution of real datasets involves complications that algorithm benchmarks rarely capture. Three categories of challenge account for most analytical failures.
Rank estimation errors represent the most consequential problem. Correct rank determination is the number of underlying chemical components the algorithm must resolve. Underestimating rank merges distinct components into a single artificial signal. Overestimating rank splits one real component into two phantom species. Neither error is obvious in the output spectrum without independent validation. Accurate rank estimation requires iterative data exploration and domain knowledge about the sample matrix, not just statistical criteria.
Co-elution, noise, and baseline shifts compound the rank estimation problem. In GC/MS analysis of environmental samples, for example, dozens of compounds may co-elute within a single chromatographic window. Baseline drift from column bleed or solvent gradients shifts the apparent signal floor, causing algorithms to misassign baseline structure as low-intensity peaks.
The following practical issues require explicit attention before running any deconvolution:
- Overlapping isotope envelopes: Common in high-molecular-weight proteins or complex lipid mixtures; requires charge state deconvolution before component separation.
- Non-negativity violations: Algorithms without physical constraints can return negative intensities, which are mathematically valid but analytically meaningless.
- Prior knowledge integration: Physical and chemical constraints such as known reference spectra, unimodality requirements, or elemental composition limits transform deconvolution from a blind fitting exercise into a guided reconstruction.
- Automated algorithm overreliance: No deconvolution software corrects fundamentally poor data quality. Spectra with signal-to-noise ratios below instrument specifications produce unreliable deconvolution outputs regardless of algorithm sophistication.
Iterative inspection of residuals after each deconvolution cycle is the most reliable diagnostic. Structured residuals indicate model misspecification; random residuals confirm adequate fit.
Software tools researchers use for mass spectral deconvolution in 2026
Widely used deconvolution tools differ substantially in automation level, algorithmic approach, and the spectral domains they address. Selecting the right tool requires matching software architecture to dataset complexity and research context.
Unidec is the standard for charge state deconvolution in native mass spectrometry and top-down proteomics. It implements Bayesian deconvolution with user-adjustable charge state ranges and mass sampling intervals. Unidec handles multiply charged protein ions effectively and outputs both deconvolved mass spectra and charge state distributions.
PyMESpec is a Python toolbox designed for multicomponent spectral deconvolution in spectroscopy and chromatography contexts. It implements FroALS and FroFPGM for MCR-ALS-style decomposition with enforced non-negativity. PyMESpec is particularly suited to plasma emission spectroscopy and Raman spectral mixture analysis.
AMDIS (Automated Mass Spectral Deconvolution and Identification System), developed by NIST, targets GC/MS data. It deconvolves co-eluting peaks in chromatographic runs and matches deconvolved spectra against the NIST mass spectral library. AMDIS remains the reference tool for environmental and forensic GC/MS workflows.
R2nsoftware’s PeakLab addresses the full analytical workflow: peak fitting, baseline correction, and mass spectral analysis within a single environment. PeakLab supports up to 1,000 simultaneous peaks, which is a capacity that separates it from tools that cap at tens or hundreds of components. Its advanced peak fitting integrates Gaussian, Lorentzian, and Voigt profile models with automated baseline modeling, making it applicable across chromatography, spectroscopy, and mass spectrometry datasets.
| Software | Primary Domain | Key Algorithm | Automation Level |
|---|---|---|---|
| Unidec | Native MS, top-down proteomics | Bayesian deconvolution | Moderate |
| PyMESpec | Spectroscopy, chromatography | FroALS, FroFPGM (MCR) | Moderate |
| AMDIS | GC/MS, environmental analysis | Spectral subtraction, library match | High |
| PeakLab (R2nsoftware) | Multi-domain analytical chemistry | Voigt/Gaussian/Lorentzian fitting | High |
For datasets involving severely overlapped peaks from low-resolution instruments, constrained spectral decomposition using high-resolution reference data as a constraint produces more accurate reconstruction than unconstrained fitting. Center-wavelength and broadening-width constraints convert purely mathematical fitting into physically guided spectral reconstruction, a distinction that matters in plasma emission spectroscopy and atomic spectrometry.
Pro Tip: For batch processing of large GC/MS datasets, pair AMDIS deconvolution with a secondary quantitative tool like PeakLab for peak area integration. AMDIS excels at identification; PeakLab provides the curve-fitting accuracy needed for defensible quantification.
Key takeaways
Mass spectral deconvolution requires accurate rank estimation, physically constrained algorithms, and parameter tuning matched to instrument resolution before algorithm selection becomes the deciding factor.
| Point | Details |
|---|---|
| Rank estimation is the critical step | Errors in component count cause underfitting or overfitting regardless of algorithm quality. |
| Physical constraints improve accuracy | Non-negativity and unimodality constraints prevent mathematically valid but chemically impossible outputs. |
| Parameter tuning outweighs algorithm complexity | Intensity thresholds and mass tolerances must match instrument resolution; defaults cause false positives. |
| ML methods require validation overhead | Machine learning approaches outperform classical methods in sensitivity but carry higher reproducibility risk in regulated settings. |
| Tool selection depends on domain | Unidec suits proteomics, AMDIS suits GC/MS, and PeakLab suits multi-domain workflows requiring high peak capacity. |
Where automation ends and judgment begins
The most persistent misconception I encounter among researchers adopting deconvolution software is that algorithm sophistication substitutes for analytical judgment. It does not. The combination of algorithmic approaches with physical and chemical knowledge is what transforms deconvolution from a black box into a defensible interpretive process. I have seen well-resourced labs produce unreliable deconvolution outputs not because they chose the wrong algorithm, but because they accepted default parameters on instruments whose resolution profiles had drifted from factory specifications.
The emergence of EnvCNN and AMTrans is genuinely significant. These models resolve overlaps that classical methods cannot. But I remain cautious about deploying them in any workflow where results feed regulatory submissions or cross-laboratory comparisons. The training dataset dependency is not a minor caveat. It is a structural limitation that requires explicit validation for each new sample class and instrument configuration.
My practical recommendation: treat deconvolution as a two-stage process. Use automated tools for initial signal separation and component identification. Then apply domain knowledge to inspect residuals, verify rank assignments, and confirm that deconvolved component spectra match chemically plausible profiles. Software accelerates the computation. The researcher still owns the interpretation.
— Nadeem
How R2nsoftware supports complex spectral deconvolution workflows
Researchers working with dense, overlapping spectral datasets need tools that go beyond standard peak picking. R2nsoftware’s PeakLab addresses this directly, supporting up to 1,000 simultaneous peaks with Voigt, Gaussian, and Lorentzian profile fitting and integrated baseline modeling. For automated signal processing workflows, AutoSingal adds machine learning-assisted signal detection and deconvolution, reducing manual parameter adjustment in high-throughput environments. Both tools are designed for researchers who need reproducible, scientifically defensible results across chromatography, spectroscopy, and mass spectrometry applications.
Explore R2nsoftware’s tutorial video library to see PeakLab and AutoSingal applied to real spectral datasets, including overlapping isotope envelope resolution and multicomponent GC/MS deconvolution.
FAQ
What is mass spectral deconvolution in simple terms?
Mass spectral deconvolution is the computational process of separating a mixed or overlapping mass spectrum into the individual pure component spectra that produced it. It enables identification and quantification of compounds that cannot be resolved by chromatographic separation alone.
How does charge state deconvolution differ from spectral deconvolution?
Charge state deconvolution is a specific subset of spectral deconvolution that converts multiply charged ion series in electrospray ionization data into neutral monoisotopic masses. General spectral deconvolution addresses the broader problem of separating any overlapping signals, including those from co-eluting chemical components.
Which deconvolution method is best for gc/ms data?
AMDIS is the reference standard for GC/MS deconvolution, using spectral subtraction and NIST library matching to identify co-eluting compounds. For quantitative accuracy after identification, curve-fitting tools such as PeakLab provide more precise peak area integration.
Why does rank estimation matter so much in multicomponent deconvolution?
Rank estimation errors directly determine whether the algorithm resolves the correct number of chemical components. Underestimating rank merges distinct species; overestimating rank generates phantom components from noise, both of which invalidate downstream quantification.
Can machine learning replace traditional deconvolution algorithms?
Machine learning models like EnvCNN outperform classical methods in resolving severely overlapped signals, but traditional methods remain more reproducible in regulated settings where training dataset dependency poses a validation risk. Most production workflows benefit from combining both approaches.