Give it a column of x and a column of y. TableCurve 2D fits all 3,665 of its built-in equations, sorts them by goodness of fit, and hands you a ranked list with the plot and the statistics for each one. The model you would have reached for is usually in there — along with several you would not have.
Most fitting tools ask which equation you want. That question caps the result at whatever you happened to think of, and it rewards whoever has the best memory for functional forms rather than whoever has the best data. TableCurve 2D asks nothing and fits everything.
Every candidate is scored on r², adjusted r², the F-statistic and the standard error of the estimate. Sort by any of them and the list reorders.
The review window plots the data, the fitted curve, confidence and prediction bands, and the residuals — so a fit that is numerically good but structurally wrong shows itself.
Once you pick a model, TableCurve writes it out as source you can paste into your own analysis — coefficients, the function and its derivatives included.
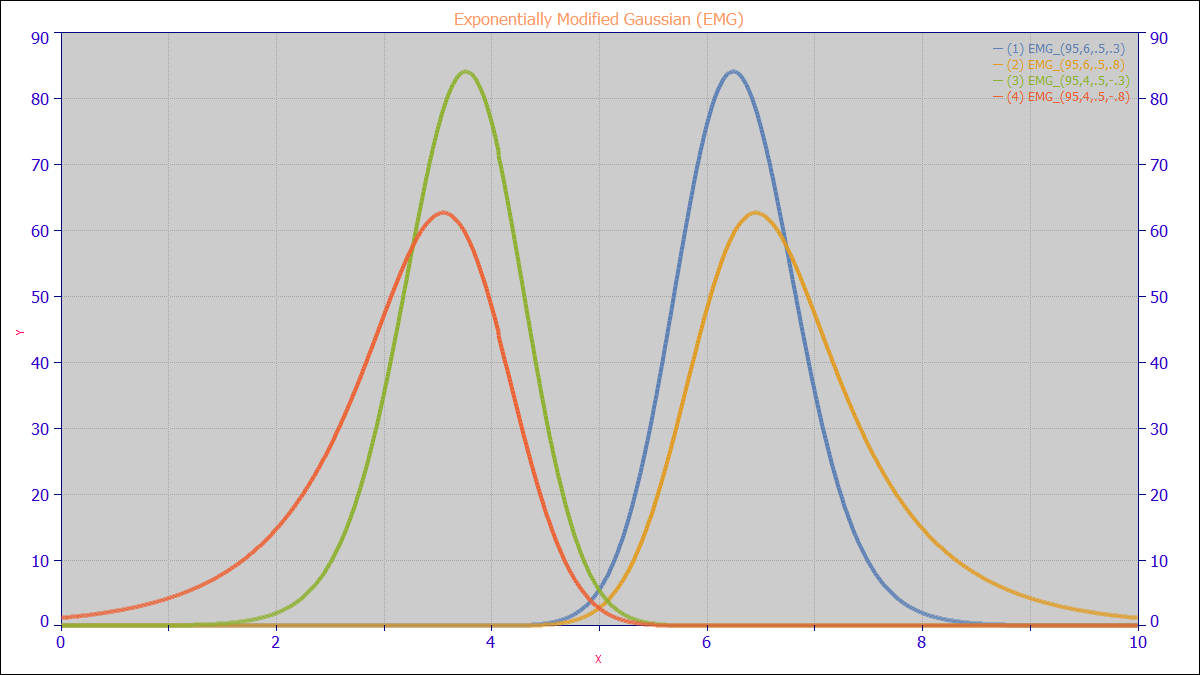
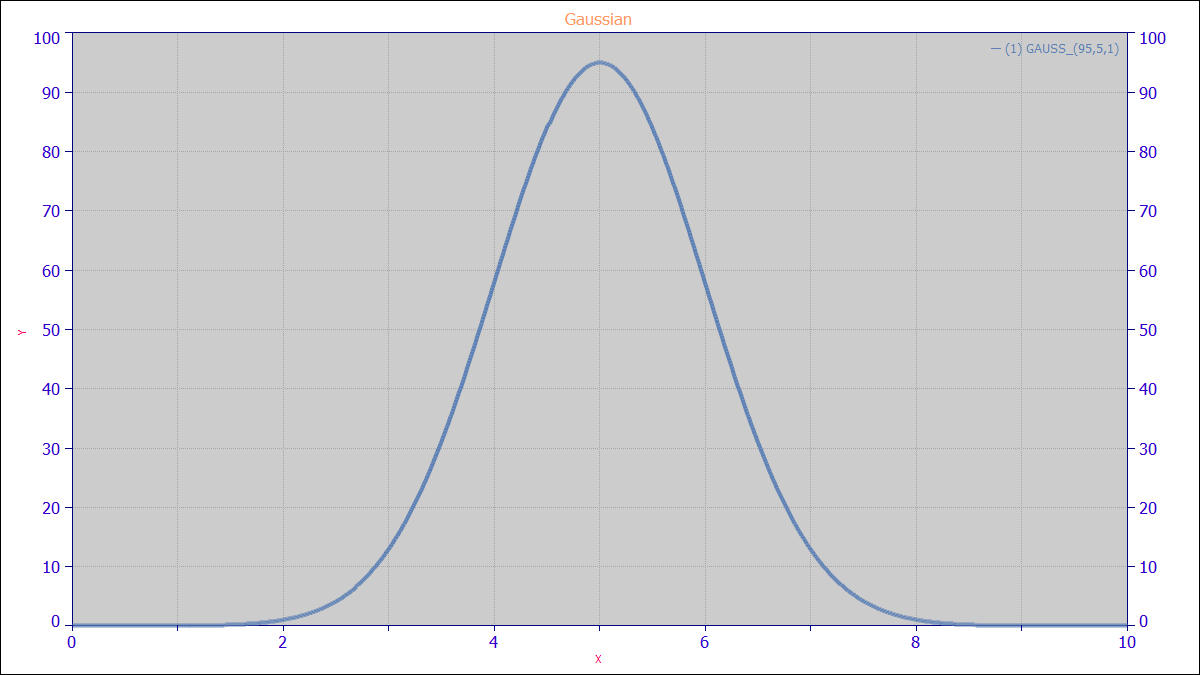
Chromatographic and spectroscopic peak shapes, sigmoids and logistic transitions are first-class equation families, not something you have to hand-enter.
Enter a user-defined function in ordinary algebraic notation and TableCurve fits it with the same engine and reports it in the same ranking.
Numeric output, graphs and the full statistical summary export to Word and Excel, so what you publish is what the program computed.
Captures from TableCurve 9 itself. The peak and transition families below are built in — nothing here was entered by hand.
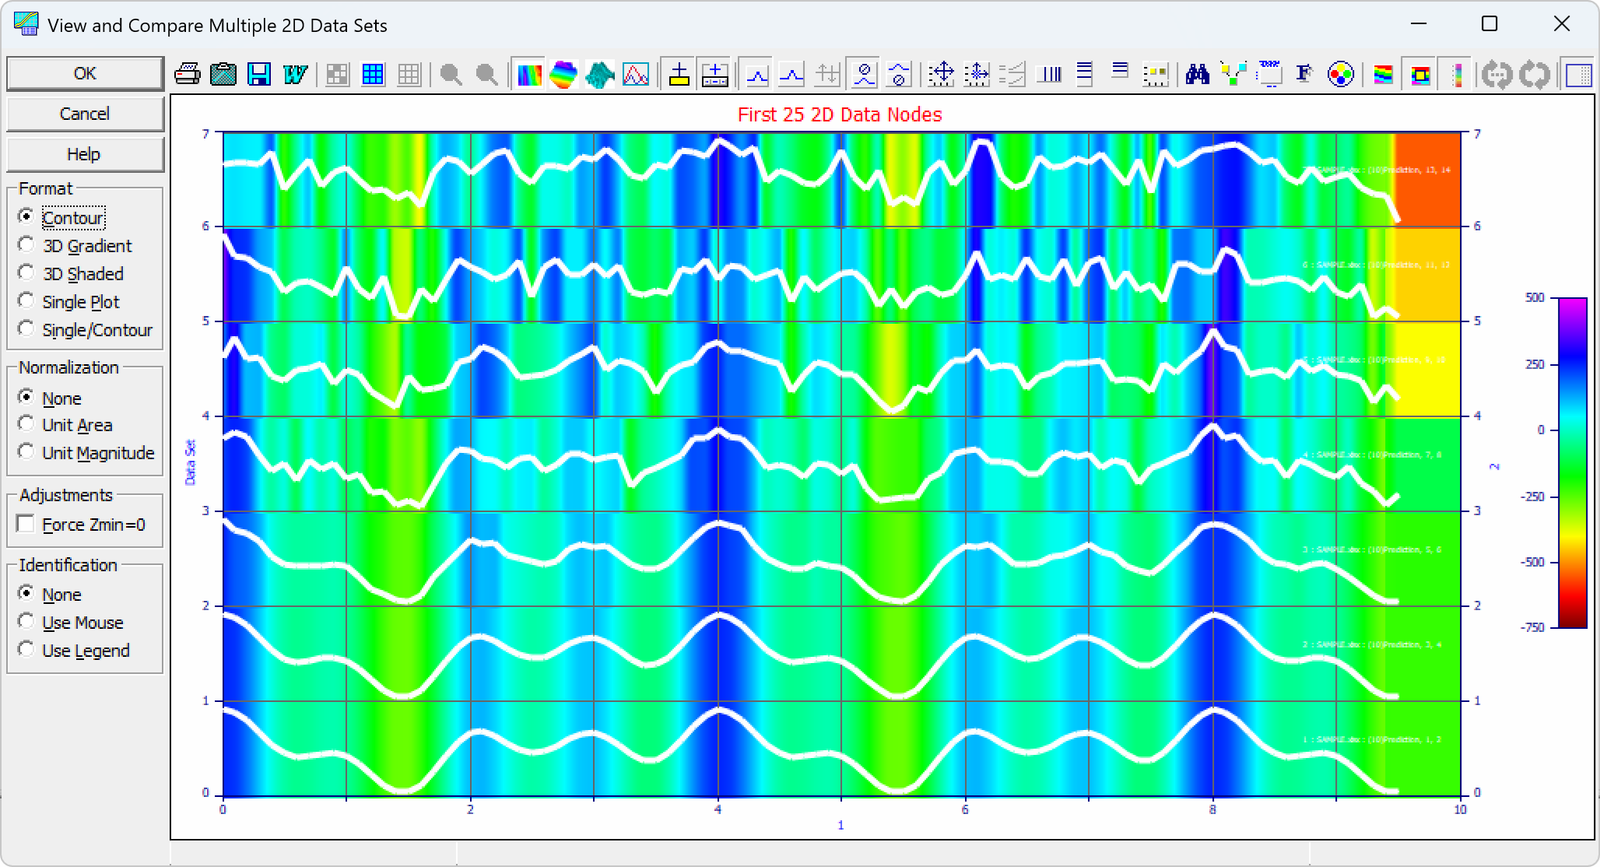
Paste from the clipboard, open a text or Excel file, or type into the data sheet. Columns become x and y.
Choose which equation families to include, then fit. Every selected equation is fitted and scored.
Walk the sorted list. Each row carries its plot, its coefficients and its residual pattern.
Export the report, the graph, or generated source code for the equation you settled on.
TableCurve 2D is the XY half of the TableCurve 9 program. It installs and licenses on its own, and upgrades to Studio by changing the licence key rather than the installation.
A 2D licence can open and view 3D functions, but surface fitting requires TableCurve 3D or Studio.
The trial runs the full equation library. If nothing in 3,665 equations fits your data, that is worth knowing too.