High Accuracy Chromatographic Peak Fitting for System Suitability and QC of Columns and
Flow Systems
When you want to know with certainty the state of a column’s health, you need to measure
the theoretical plates of just the column’s separation, not artifacts of injectors,
detector cells, or changes in the fluid flow path.
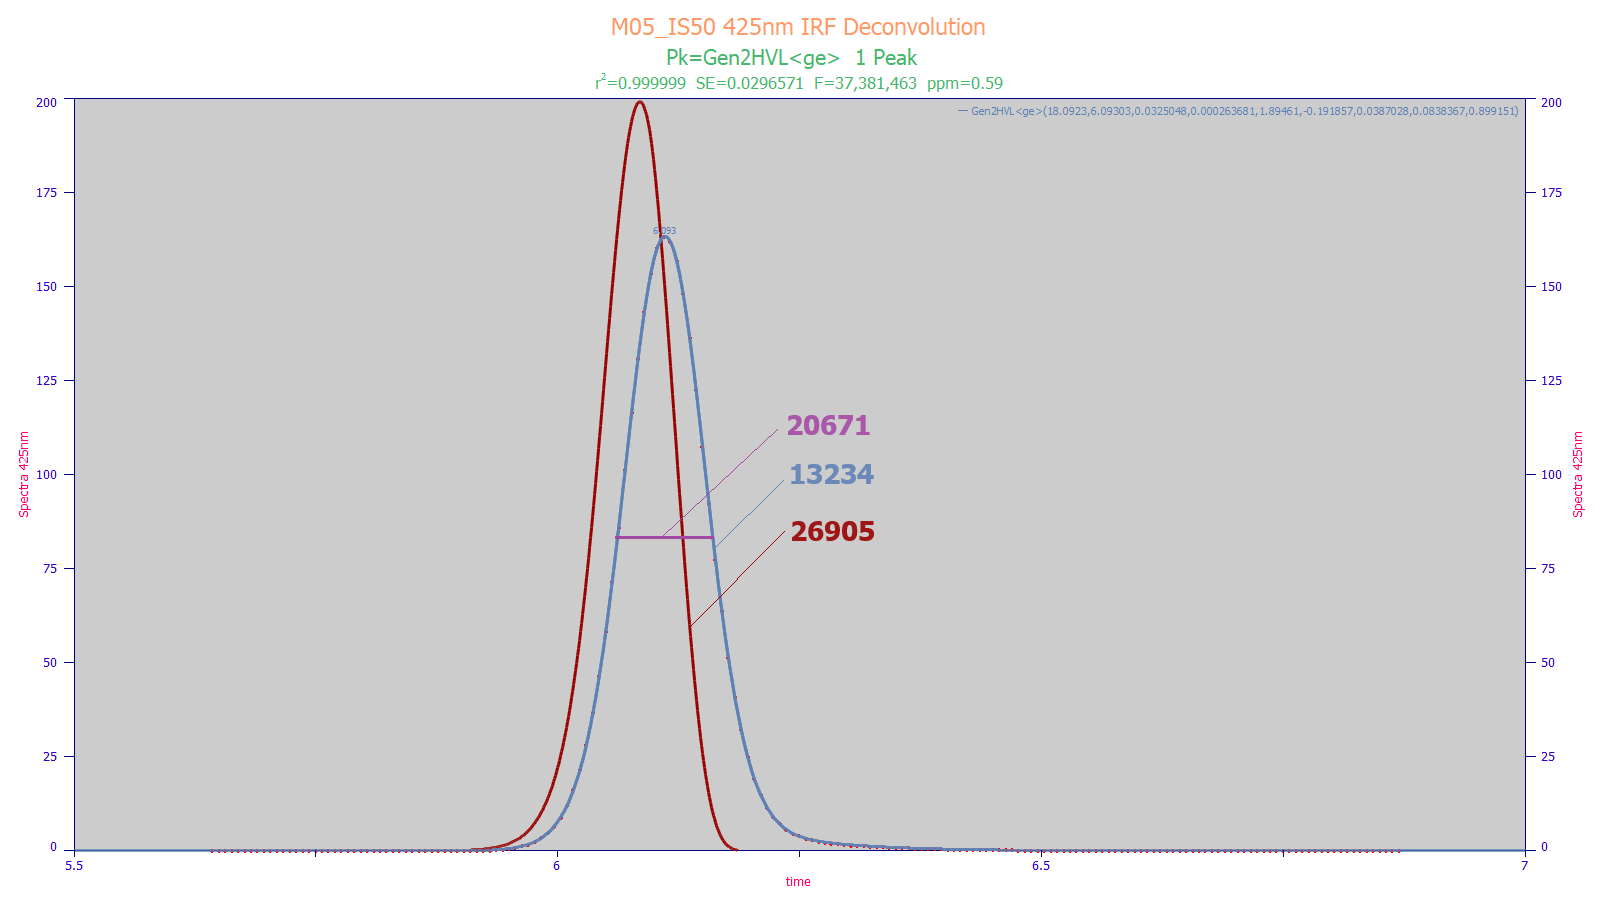
PeakLab fits chromatographic peaks to near perfect goodness of fit values. In the above
UHPLC C18 peak fit, the 0.59 ppm unaccounted variance equates to a r2 goodness of fit
greater than 0.999999, allowing separation of the column peak from all instrumental
distortions. In the fit above, the blue is the observed peak, the red is the peak
specific to the column separation minus all instrumental effects. The FWHM traditional
Gaussian estimate of N uses only the magenta half-width and produces an N=20,671. The
moment method accounts the full blue peak, but that includes the instrumental effects
and tailing, and this results in N=13,234. The red deconvolved peak consists of only the
column separation minus the instrumental distortions, N=26,905.
PeakLab goes one step further offering a model-based N which removes higher moment
differences. such as those which can arise from the packing variation in narrow diameter
columns and other nonidealities. For the above peak, the model-based N=35,137, the value
that would be seen if the packing and interphase mass transfer were perfectly uniform.
Quantifying the instrument response function (IRF) parameters has value as well. The IRF
parameters will catch aging injectors, flow path changes, and differences in detectors.
Identifying the IRF also assists in designing preps that minimize these instrumental
distortions, such as the differences in mobile phase solvents.